-
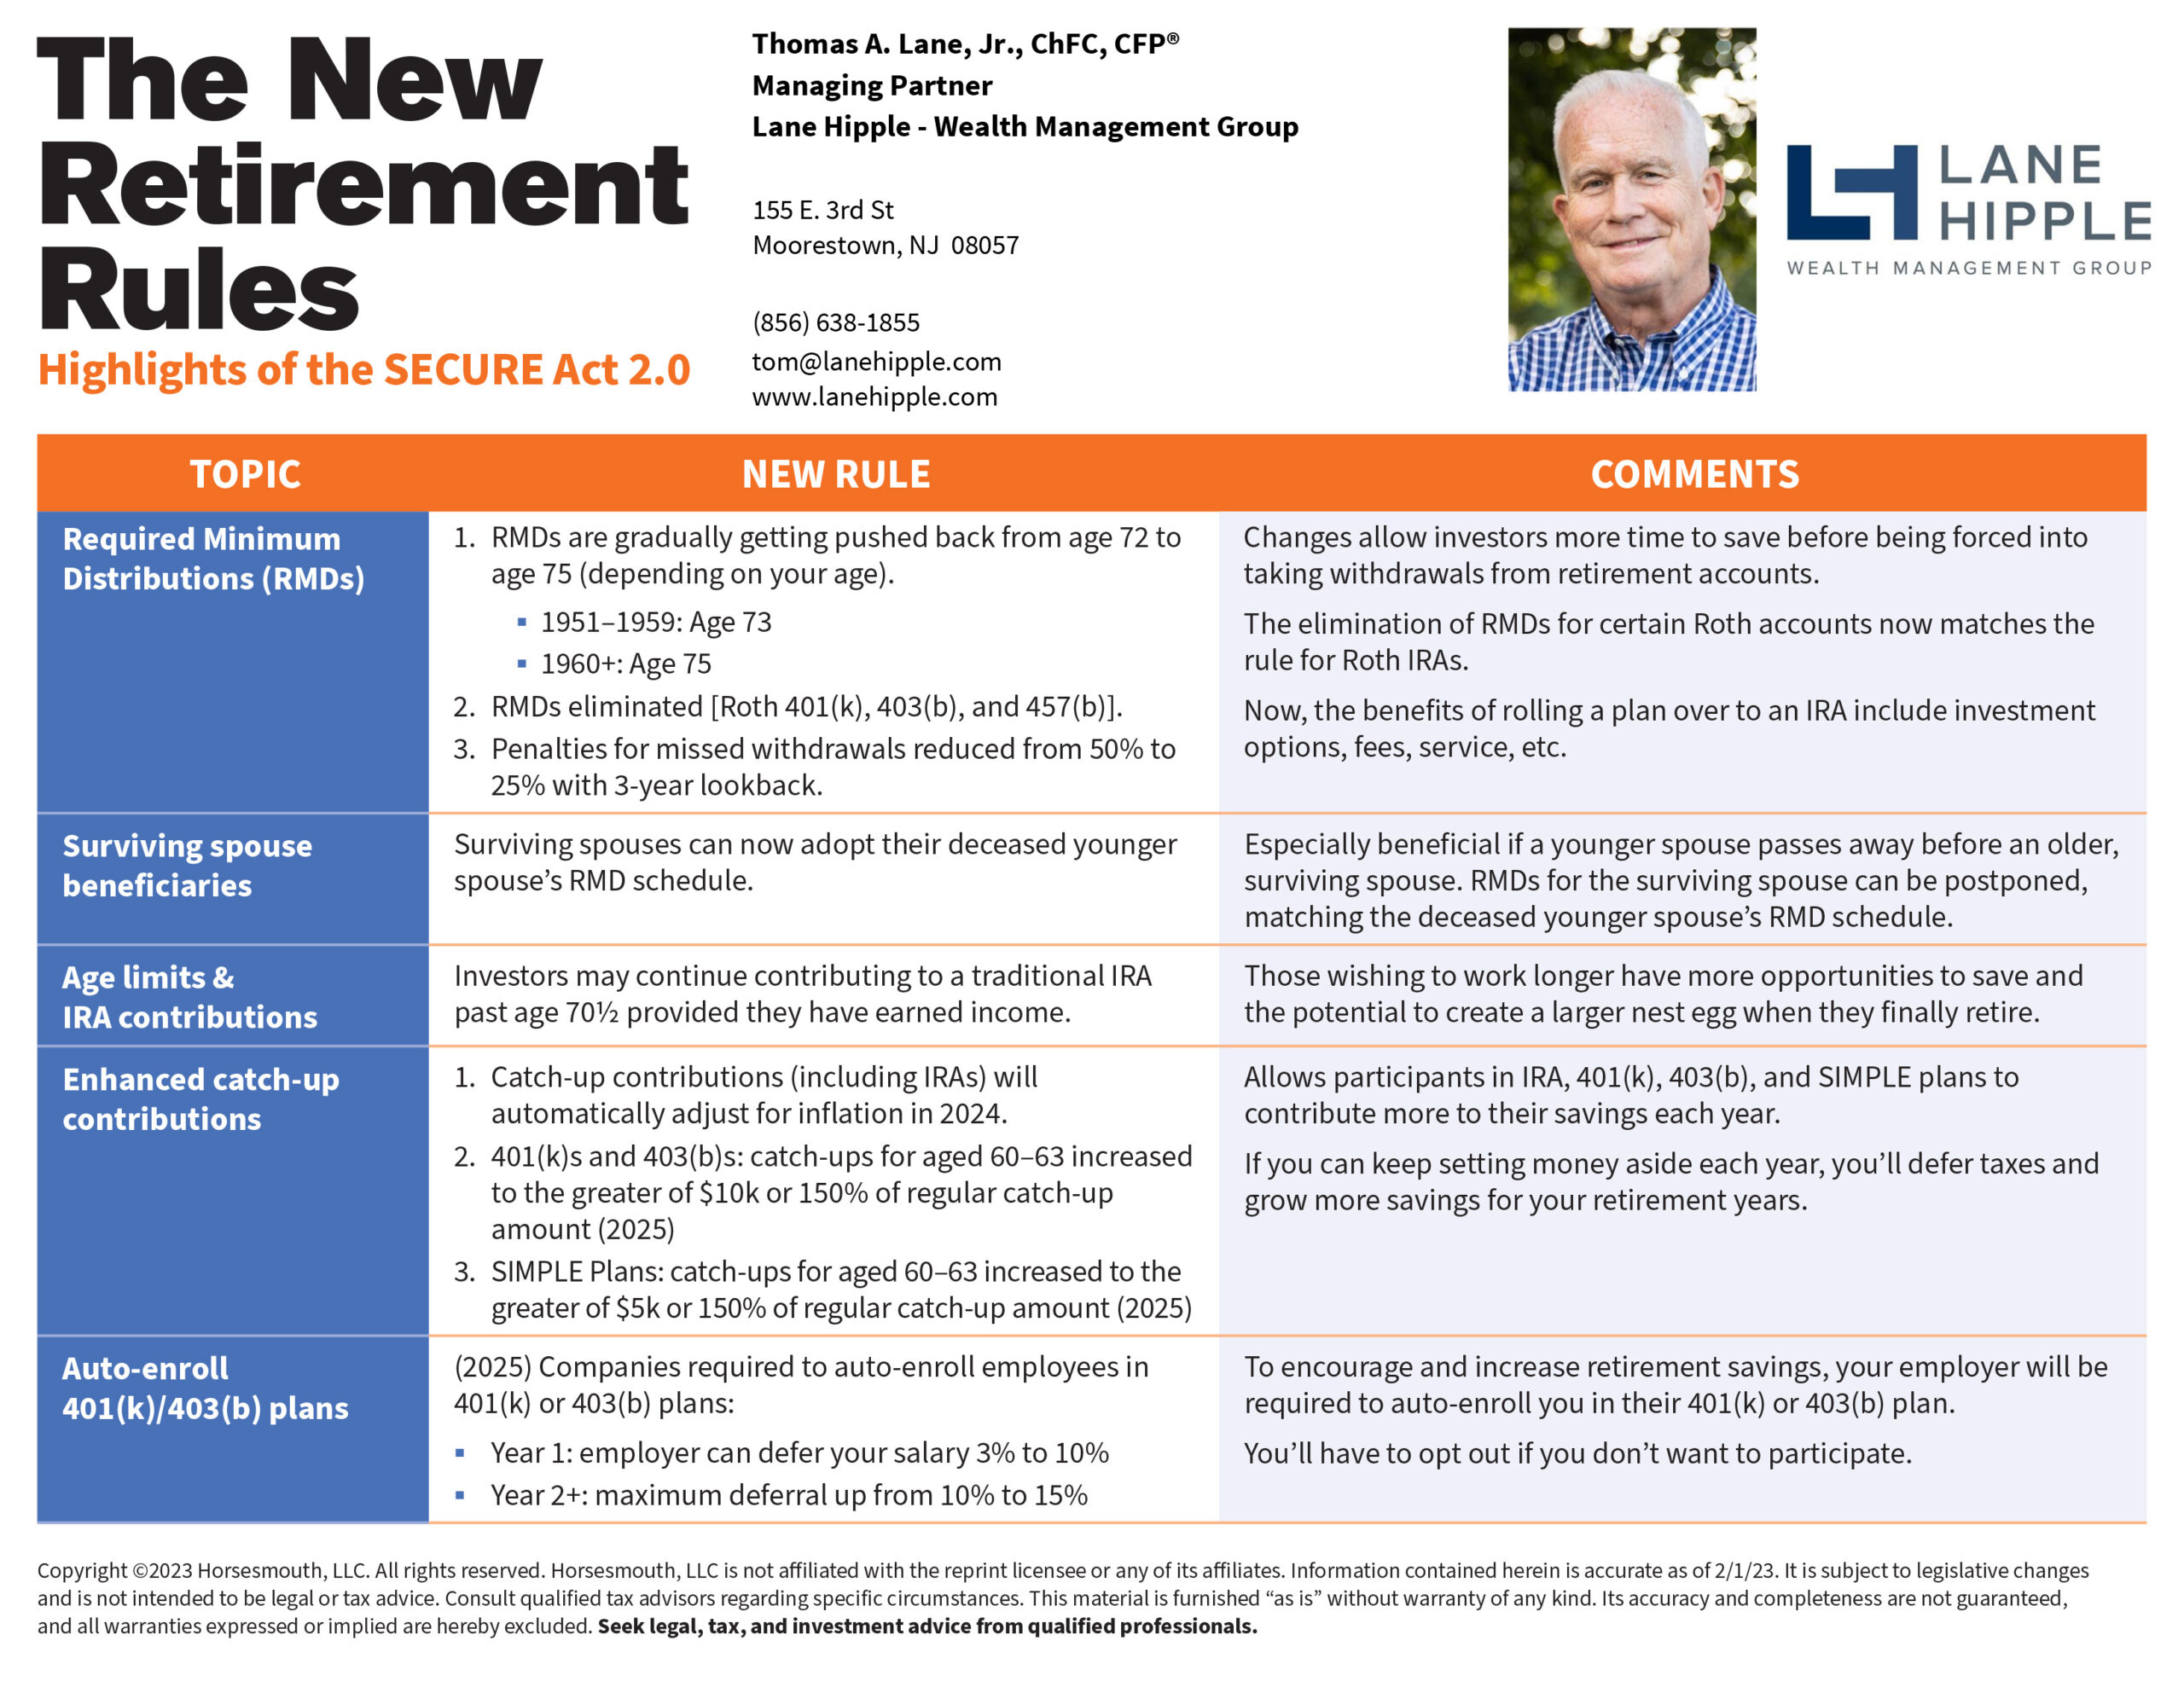
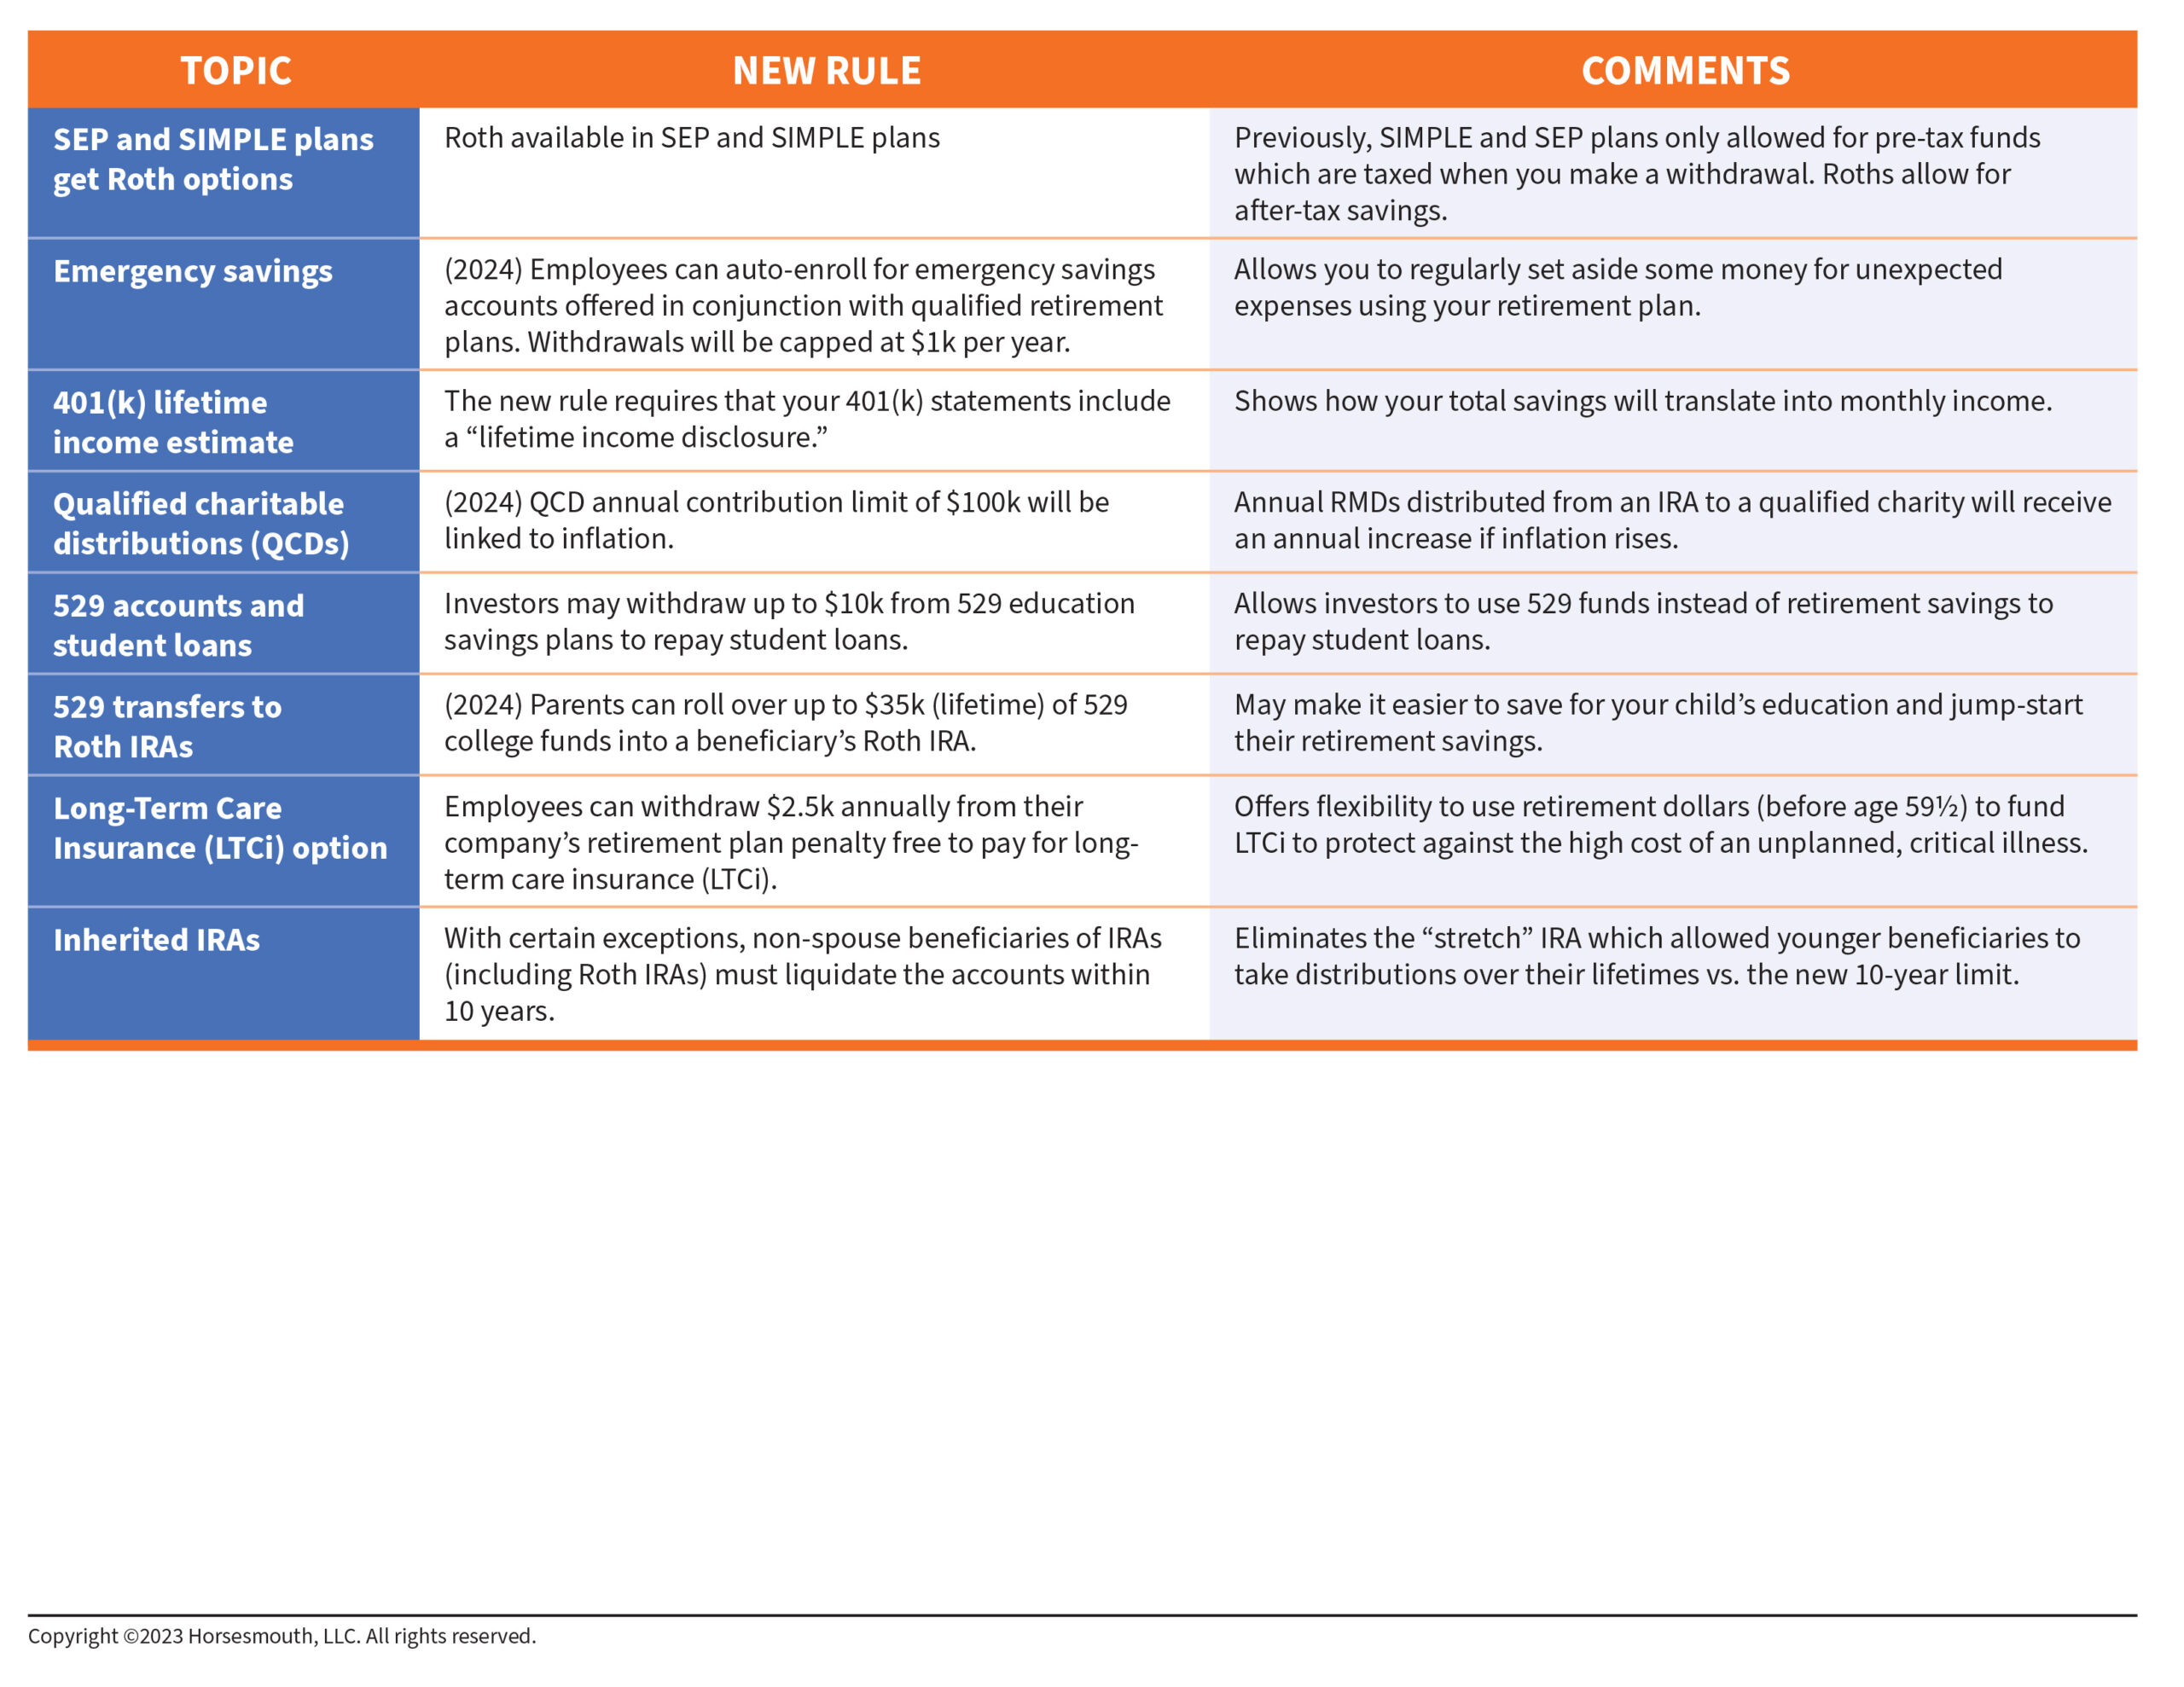
The New Retirement Rules
Highlights of the SECURE Act 2.0
-
5 Ways a Financial Advisor Can Help You Prepare for Tax Season

A Strong Tax Strategy is Part of a Thoughtful, Comprehensive Financial Plan
Tax season is upon us and, while not every financial advisor is a Certified Public Accountant (CPA), that doesn’t mean they can’t be helpful. Your financial advisor can assist you with making strategic tax moves throughout the year to help reduce your overall tax burden. As you read below, keep in mind that the sooner you begin having these conversations with your advisor about your tax strategy, the better off you’ll be at tax time.
Finding Ways to Maximize Your Tax Savings
There are many financial moves you can make throughout the year that will result in paying lower taxes, and a financial advisor will be educated about them. For example, some investment accounts let you make tax-deferred contributions, which can offer you the opportunity to save money on taxes while working to build your retirement savings. Take a company-sponsored 401(k), for instance. If you max out your contributions to this account, all of the money going in is pre-taxed, so you’ll be putting money away for retirement while reducing your tax bill in the present.
Keeping Record of Your Capital Gains and Losses
When filing your taxes, you’ll have to know how much you earned and lost from your investments for that year. A financial advisor will have an accurate and consistent record of your investments, which they can give to your accountant on your behalf. This will save you time and energy, and help you ensure you’re paying appropriate capital gains tax, without over-paying.
Developing a Tax-Savvy Gifting Strategy
There’s a lot to be gained when we gift our money to others. Not only do you get the intrinsic rewards associated with the joy and meaning that comes from helping others, but you can enjoy valuable tax benefits, too. Sit down with your financial advisor and discuss how you can gift your money in ways that ultimately help lower your tax bill, too. And this isn’t just for charities; if you want to give money to your family members for any reason, there are plenty of gifting strategies that let you transfer your wealth without a tax penalty. Check-in with your financial advisor before making any gifts so you can be sure to maximize the opportunity.
8 Considerations For Passing an Inheritance To Your Children
Minimizing the Tax Burden that RMDs Bring
Once you reach the age of 73, you’ll have to begin taking out Required Minimum Distributions (RMDs) from any IRA or 401(k) accounts that you have. While this comes as no surprise, often the uptick in your tax bill from having to pay income tax on those distributions does come as a surprise to retirees. A financial advisor will be able to provide you with management strategies so that you can lower your tax liabilities and be more prepared when the time comes to begin taking distributions.
Determining Tax-Efficient Investment Strategies
Although a financial advisor can’t necessarily protect you from capital gains tax, they will be able to help you by implementing strategies such as tax-loss harvesting, offsetting gains with losses, and avoiding issues such as “phantom tax,” which limit your overall tax liability. So, they’ll not only be able to help you manage and balance a portfolio, but they’ll be able to ensure you’re following the best investment strategies to benefit you the most when it comes time to file your taxes.
Do You Need a Financial Advisor to Assist with a Tax Strategy?
The world of taxes can be incredibly confusing, especially considering they’re constantly changing depending on the economy and new legislation. Having a financial advisor you trust is an important addition to your tax planning arsenal. A financial advisor can guide you throughout the year to ensure you’re making the best financial choices to help boost your tax strategy, with the ultimate goal of allowing you to save more of your hard-earned dollars.
If you think you would benefit from a conversation about your tax strategy, contact Lane Hipple Wealth Management Group at our Moorestown, NJ office by calling 856-638-1855, emailing info@lanehipple.com, or to schedule a complimentary discovery call, use this link to find a convenient time.
Illuminated Advisors is the original creator of the content shared herein. I have been granted a license in perpetuity to publish this article on my website’s blog and share its contents on social media platforms. I have no right to distribute the articles, or any other content provided to me, or my Firm, by Illuminated Advisors in a printed or otherwise non-digital format. I am not permitted to use the content provided to me or my firm by Illuminated Advisors in videos, audio publications, or in books of any kind.
-
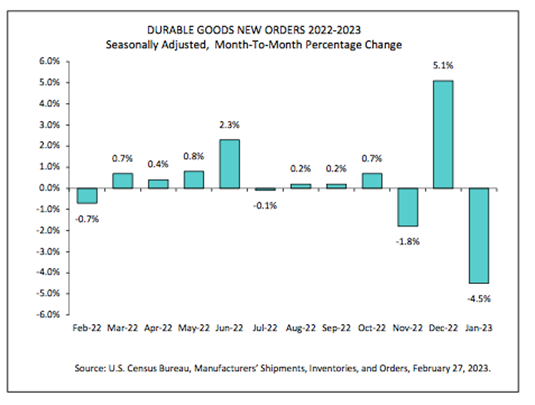
Durable Goods Orders Sink by 4.5%

On Tuesday, the U.S. Census Bureau announced the January advance report on durable goods manufacturers’ shipments, inventories and orders:
New Orders
- New orders for manufactured durable goods in January, down two of the last three months, decreased $13.0 billion or 4.5% to $272.3 billion. This followed a 5.1% December increase.
- Excluding transportation, new orders increased 0.7%. Excluding defense, new orders decreased 5.1%.
- Transportation equipment, also down two of the last three months, drove the decrease, $14.2 billion or 13.3% to $92.8 billion.
Shipments
Shipments of manufactured durable goods in January, down following sixteen consecutive monthly increases, decreased $0.2 billion or 0.1% to $277.2 billion. This followed a 0.4% December increase. Transportation equipment, down following ten consecutive monthly increases, drove the decrease, $1.6 billion or 1.7% to $92.2 billion.
Unfilled Orders
Unfilled orders for manufactured durable goods in January, up twenty-nine consecutive months, increased $0.3 billion or virtually unchanged to $1,157.0 billion. This followed a 1.1% December increase. Transportation equipment, up twenty-three of the last twenty-four months, drove the increase, $0.7 billion or 0.1% to $684.6 billion.
Inventories
Inventories of manufactured durable goods in January, down following twenty-three consecutive monthly increases, decreased $0.4 billion or 0.1% to $493.1 billion. This followed a 0.7% December increase. Transportation equipment, down following two consecutive monthly increases, led the decrease, $0.3 billion or 0.2% to $158.3 billion.
Capital Goods
Nondefense new orders for capital goods in January decreased $15.2 billion or 15.3% to $83.9 billion. Shipments decreased $0.8 billion or 1.0% to $84.3 billion. Unfilled orders decreased $0.4 billion or 0.1% to $664.1 billion. Inventories decreased $0.5 billion or 0.2% to $218.5 billion. Defense new orders for capital goods in January increased $0.6 billion or 3.8% to $15.8 billion. Shipments decreased $0.2 billion or 1.2% to $14.9 billion. Unfilled orders increased $0.9 billion or 0.5% to $189.2 billion. Inventories increased $0.2 billion or 0.9% to $23.2 billion.
Sources: census.gov

-
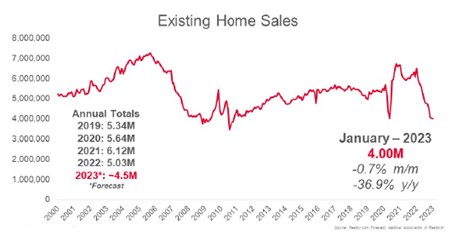
Existing Home Sales Drop for 12th Straight Month, Lowest Since 2010

On Tuesday, the National Association of Realtors reported that existing-home sales fell for the 12th straight month in January. In addition, month-over-month sales were mixed among the four major U.S. regions, as the South and West registered increases, while the East and Midwest experienced declines. All regions recorded year-over-year declines.
Housing Highlights
- Existing-home sales waned for the twelfth consecutive month to a seasonally adjusted annual rate of 4.00 million. Sales slipped 0.7% from December 2022 and 36.9% from the previous year.
- The median existing-home sales price increased 1.3% from one year ago to $359,000.
- The inventory of unsold existing homes grew from the prior month to 980,000 at the end of January, or the equivalent of 2.9 months’ supply at the current monthly sales pace.
Bottoming Out?
“Home sales are bottoming out. Prices vary depending on a market’s affordability, with lower-priced regions witnessing modest growth and more expensive regions experiencing declines. Inventory remains low, but buyers are beginning to have better negotiating power.
Homes sitting on the market for more than 60 days can be purchased for around 10% less than the original list price.”
- The median existing-home pricefor all housing types in January was $359,000, an increase of 1.3% from January 2022 ($354,300), as prices climbed in three out of four U.S. regions while falling in the West.
- This marks 131 consecutive months of year-over-year increases, the longest-running streak on record.
- Properties typically remained on the market for 33 days in January, up from 26 in December and 19 in January 2022. 54% of homes sold in January were on the market for less than a month.
Location, Location, Location- Existing-home sales in the Northeast retracted 3.8% from December, down 35.9% from January 2022. The median price in the Northeast was $383,000, up 0.3% from the previous year.
- In the Midwest, existing-home sales slid 5.0% from the previous month, declining 33.3% from one year ago. The median price in the Midwest was $252,300, up 2.7% from January 2022.
- Existing-home sales in the South rose 1.1% in January from December, a 36.6% decrease from the prior year. The median price in the South was $332,500, an increase of 3.4% from one year ago.
- In the West, existing-home sales elevated 2.9% in January, down 42.4% from the previous year. The median price in the West was $525,200, down 4.6% from January 2022.
Sources: nar.realtor
Copyright © 2023 MainStreet Journal. All rights reserved
Distributed by Financial Media Exchange. -
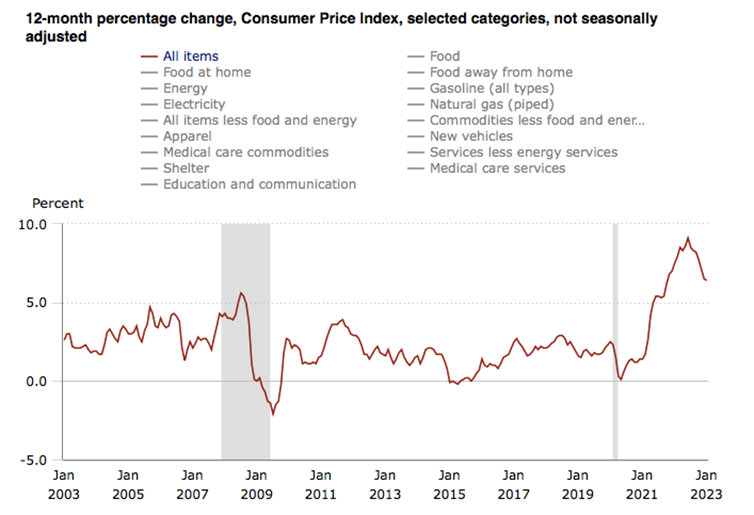
Inflation Was Up 0.5% in January and 6.4% Over the Past 12-Months

On Tuesday, the U.S. Bureau of Labor Statistics reported that the Consumer Price Index for All Urban Consumers (CPI-U) rose 0.5% in January on a seasonally adjusted basis, after increasing 0.1% in December. Over the last 12 months, the all items index increased 6.4% before seasonal adjustment.

Specifically:
- The index for shelter was by far the largest contributor to the monthly all items increase, accounting for nearly half of the monthly all items increase, with the indexes for food, gasoline, and natural gas also contributing.
- The food index increased 0.5% over the month with the food at home index rising 0.4%.
- The energy index increased 2.0% over the month as all major energy component indexes rose over the month.
The index for all items less food and energy rose 0.4% in January. Categories which increased in January include the shelter, motor vehicle insurance, recreation, apparel, and household furnishings and operations indexes. The indexes for used cars and trucks, medical care, and airline fares were among those that decreased over the month.
The all items index increased 6.4% for the 12 months ending January; this was the smallest 12-month increase since the period ending October 2021. The all items less food and energy index rose 5.6% over the last 12 months, its smallest 12-month increase since December 2021. The energy index increased 8.7% for the 12 months ending January, and the food index increased 10.1%.
Items of Note January 2023 12-Months Ended January 2023 All Items 0.5% 6.4% Food 0.5% 10.1% Energy 2.0% 8.7% Fuel Oil -1.2% 27.7% Utility (piped) gas service 6.7% 26.7% Used cars and trucks -1.9% -11.6% Shelter 0.7% 7.9% Inflation Over the Past 20-Years
Sources: bls.gov