-
Annuities: The Good, the Bad, and the Ugly

Written by Thomas A. Lane, Jr., ChFC®, CFP®
“I HATE annuities, and you should too” is a popular marketing campaign utilized by a national investment advisory firm to create uncertainty and fear among annuity owners with the hope they will seek out their firm who will then “rescue” them from these “horrific” products.
Is there any basis or truth to such a comment? I can only assume that the owner of that firm probably does hate annuities. That said, he is making a very broad statement inferring that ALL annuities are bad, which, of course, is not the case. Annuities receive a lot of press, some good, some bad, some ugly, and deservedly so. Annuities are pushed very hard by insurance salesmen and brokers who are paid, often times, excessive commissions, by the insurance companies to peddle their products, without consideration to the needs of the individual or couple to whom they are selling the annuity. The truth of the matter is that not all annuities are bad and not all annuities are great. In my many years of practice as a CFP® professional, I have seen all types of annuities. Some of which have been a nightmare for clients in terms of fees, expenses, and poor performance; and some that have worked extremely well.
The problem with annuities is that they are often painted with a broad brush by the uninformed media as being “bad”. It is this overwhelming belief by consumers that prevents them from enjoying the benefits the right annuity can offer. As a result, when an annuity is recommended to a client by an experienced advisor who clearly has his client’s best interest at heart, the client will often react defensively and may miss out on a perfectly reasonable solution to their specific financial need. As with any solution to a specific planning need, annuities are not an elixir, and there is no “one size fits all”.
Types of Annuities:
Fixed, Variable, Indexed, Deferred, Immediate, Longevity. What to do these terms have in common? They all describe different types of annuities that are as different as their names imply. Unfortunately for the consumer, it is very difficult to understand the differences between the several types of annuities and, more specifically, how they work before making a determination as to whether or not they have a need for an annuity.
It is beyond the scope of this article to provide an in-depth description of each product, so I will provide a brief overview of each and will keep the description of each as generic and simple as possible so as to provide the reader with a basic understanding of various types of annuities.
Fixed Annuity: The simplest way to describe a fixed annuity is to imagine a tax-deferred CD. This is not to imply that a fixed annuity is a bank product that offers the guarantees associated with FDIC insured products. For example, if you purchase a five-year fixed annuity, a pre-determined fixed rate of interest is credited annually for five years. Interest is not taxable during the deferral period unless withdrawn from the contract. After five years, the annuity can be 1) “cashed in”, at which time tax would be due on the accrued interest, 2) left with the insurance company for an additional five years, or 3) exchanged (without tax¹) for a new annuity at a different insurance company if more competitive rates are available. Barring cashing in the annuity during the “penalty” period, you can’t “lose” money in this type of annuity².
Indexed Annuity: Indexed annuities are similar to a fixed-rate annuity, with the exception of how the insurance company credits interest. Rather than a “declared” or fixed rate, the interest credited to the annuity is linked to an index, i.e., the S&P 500, subject to a cap. For example, if the annual cap is set at 5%, and the index earned 9%, the interest credit would be 5% for that contract year. However, if the index is negative for the year, regardless of how steep the decline, there is simply no interest credit. The annuity does not lose value. Indexed annuities also offer additional benefits, for a fee, including enhanced income and death benefits that are beyond the scope of this article.
Variable Annuity: A variable annuity (VA) is considered a “security” and can only be sold by a registered representative. A VA might be viewed as a tax-deferred mutual fund account, however, with much greater fees. VAs historically have very high fees, which eat into the returns offered by these contracts. Some VAs offer “enhanced” income or death benefits that can justify paying high fees if real value is created by protecting the annuity owner and/or beneficiaries against market risk. VAs are very complex products and should be considered only when enhanced benefits are offered that are desired by the consumer. It is important to note that money can be lost in a VA, as the funds are invested in sub-accounts/mutual funds that are directly invested in the equity and bond markets.
Immediate Annuity: A single premium immediate annuity (SPIA) is a contract between an insurance company and the annuitant where, in exchange for a lump-sum of capital, the annuitant receives a guaranteed stream of income, often times payable for life, or joint lives. A SPIA can maximize the amount of income the annuitant can receive from a lump-sum of capital since the payments consist of both principal and interest. A SPIA is appropriate for someone who is concerned about spending down assets during their lifetime. A good financial planner can help a client determine when an immediate annuity is appropriate, and if so, which type of payout structure is optimal to meet their needs.
Longevity Annuities: These products are similar to the above-referenced SPIA and were brought to market by the insurance industry as a solution for the client who fears “living too long” and running out of money. These products, while much more complex in how payments are calculated, provide guaranteed income starting at a pre-determined age, typically as late as ages 80 or 85. The amount of income that can be generated at a pre-determined point in time can be substantial when compared to more traditional options; not due to unreasonably high rates of returns, but for the simple concept of “surviving” to the specific age when the payments commence. Mortality credits are applied to the annuitant who attains a certain age, at which time the payments commence and greatly enhance the amount of income paid.
As with any of the aforementioned annuity products, careful thought and consideration must be given before purchasing any type of annuity contract, as they are very complex and there are “the Good, the Bad, and the Ugly” in terms of product choices for every type of annuity. I suggest that you consult with a qualified advisor who understands how annuities work and will act in your best interest when recommending an annuity product to meet your specific needs.
An excellent resource for information about all types of annuities can be found at http://www.annuityfyi.com. I have often used this site during my career when researching various annuity products for our clients.
¹ via a 1035 Exchange, which if done properly allows an annuity owner to “exchange” on annuity for another company’s annuity without paying tax on the accrued interest.
² Principal is guaranteed by the issuing life insurance company. Losses may be suffered if the annuity contract is surrendered during the first five years.
-
Social Security Benefits Set to Increase in 2024

Proper financial planning includes forecasting future Social Security benefits
In a welcome development for millions of Americans relying on Social Security, the Social Security Administration has recently announced an increase in retirement and disability benefits. Starting in January 2024, recipients will see a meaningful boost, with benefits set to rise by 3.2%, translating to an average increase of more than $50 a month.
This cost-of-living adjustment (COLA) marks a helpful step in ensuring financial stability for retirees and individuals with disabilities, impacting over 71 million Social Security beneficiaries across the nation.
Historic Increases
This COLA increase of 3.2% follows a historic 8.7% surge for 2023 and a 5.9% rise in 2022. These significant adjustments are a testament to the government’s commitment to addressing the rising cost of living, especially for those who depend on Social Security benefits as a primary source of income.
Impact on Recipients
For the average recipient, the 3.2% increase means more than just additional dollars in their monthly budget. It signifies improved financial security, providing a cushion against inflation and ensuring that essential needs are met with less strain. This extra income can contribute to covering healthcare expenses, purchasing necessities, and even indulging in a few luxuries, hopefully enhancing the overall quality of life for retirees and disabled individuals.
Importance of Social Security Forecasting
Understanding and forecasting Social Security benefits are vital components of financial planning. As demonstrated by the recent COLA adjustments, these benefits are subject to change, and staying informed about these fluctuations is essential for effective financial planning.
Retirement Planning: For those approaching retirement, accurately estimating Social Security benefits can help plan for additional income streams and bridge the gap between retirement savings and living expenses.
Budgeting: Knowing the exact amount of the monthly benefit allows individuals to budget effectively, ensuring that essential expenses are covered without relying solely on these funds.
Long-term Financial Security: Forecasting Social Security benefits aids in long-term financial planning, enabling individuals to make informed decisions about investments, healthcare costs, and potential legacy planning.
Disability and Survivor Benefits: For those receiving disability benefits, understanding the potential adjustments in benefits can help plan for healthcare and support services, ensuring a higher quality of life despite the challenges faced.
The Elephant in the Room
Relying solely on Social Security as a primary source of income during retirement, however, is a very risky proposition, and any good financial advisor will caution against this for several reasons.
Firstly, the future of Social Security benefits is uncertain. While the government has taken steps to address immediate concerns, the program is projected to face financial challenges due to the aging population and a declining worker-to-beneficiary ratio. With a growing number of retirees drawing from the system and a shrinking workforce contributing, there are concerns about the long-term sustainability of Social Security in its current form.
Secondly, Social Security benefits alone might not be sufficient to maintain the standard of living many individuals desire during retirement. The benefits are designed to replace only a portion of pre-retirement income, and for many people, especially those with higher incomes before retirement, this replacement rate might not be enough to cover essential living expenses, healthcare costs, and other financial obligations. Depending solely on these benefits could lead to financial hardship, forcing retirees to compromise on their lifestyle or struggle with unexpected expenses.
Additionally, the cost of living adjustments made to Social Security benefits might not keep up with the actual rise in living expenses, particularly healthcare and housing costs, which tend to increase at a faster rate than the general inflation rate. This discrepancy can erode the purchasing power of Social Security benefits over time, making it challenging for retirees to keep up with rising costs.
Planning Matters
The increase in Social Security benefits by 3.2%, coupled with previous historic adjustments, is a significant stride towards supporting the financial well-being of retirees and disabled individuals. Proper financial planning, including forecasting Social Security benefits, empowers individuals to navigate their financial futures with confidence, ensuring a comfortable and secure retirement.
However, while Social Security benefits can provide crucial support, they should be viewed as a supplemental income rather than the sole foundation of a retirement plan. Diversifying income sources, such as personal savings, investments, and employer-sponsored retirement accounts, is essential for building a robust financial cushion that can withstand the uncertainties of the future and ensure a comfortable retirement.
Accordingly, as these benefits evolve, staying informed and seeking guidance from financial experts becomes paramount, allowing Americans to make the most out of their hard-earned benefits and enjoy their golden years with peace of mind.
Copyright © 2023 FMeX. All rights reserved.
Distributed by Financial Media Exchange. -
Crucial Estate Planning Steps Before It’s Too Late

Countdown to the sunset of the 2017 Tax Cuts and Jobs Act has started
As 2026 approaches, the financial and legal communities are abuzz with discussions about the imminent sunset of the 2017 Tax Cuts and Jobs Act. For many, this translates to pressing changes affecting estate planning.
With only two years left to address these modifications, it’s imperative to understand the urgency and take action now.
Understanding the Impending Estate Planning Changes
The 2017 Tax Cuts and Jobs Act introduced favorable estate tax provisions, offering a hefty federal estate tax exemption of $12.92 million per person. However, by January 1, 2026, this exemption is set to drop significantly to roughly half its current value, adjusted for inflation.
Related Article: What to Do Before the Tax Cuts and Jobs Act Provisions Sunset
Why Immediate Action is Essential
Estate planning is not a process to be hurried. Comprehensive strategies, especially ones revolving around gifting to trusts or establishing gifting vehicles, demand time. Here’s why immediate action is crucial:
Short Planning Window: Two years might seem adequate. However, in the realm of estate planning, it’s but a blink of an eye. Advisors and clients alike must act swiftly.
Overwhelmed Attorneys: As the 2026 deadline approaches, estate planning attorneys will inevitably face a surge in demand. This influx means many attorneys might stop accepting new clients long before the deadline, leaving procrastinators in a lurch.
Maximizing the Exemption: By acting now, you’ll make the most of the current exemption before it reduces, potentially saving millions in estate taxes.
Estate Planning Steps Clients Should Take Immediately
Consult Your Advisor: If you haven’t already, now is the time to meet with your financial advisor. They can provide insights tailored to your unique financial situation.
Review Your Current Estate Plan: Understand the implications of the looming changes on your existing estate plan. A periodic review is always advisable, but now it’s non-negotiable.
Consider Gifting: With the high exemption limit, consider gifting assets to trusts or using other gifting vehicles. It’s a prime opportunity to move wealth out of your estate and leverage the generous exemptions.
Engage an Estate Planning Attorney: Given the anticipated demand surge, seek out and engage a reputable estate planning attorney sooner rather than later.
Stay Updated: As we inch closer to 2026, there might be new legislative changes, court rulings, or other factors impacting estate planning. Regularly check in with your advisor to stay abreast of these changes.
Act Now
The countdown to the sunset of the 2017 Tax Cuts and Jobs Act provisions is more than a looming date on the calendar; it’s a clarion call for immediate action. As a client, seizing the moment now can mean securing a more stable financial legacy for your heirs.
Don’t wait until it’s too late; the time to act is now.

-
Are We On the Brink of the Elusive Soft Landing?

Signs are encouraging and the possibility seems more tangible than ever
In the intricate world of economics, maneuvering the vast U.S. economy without causing disruptions is likened to steering a colossal ship through a tempestuous storm. Since early 2022, U.S. policymakers, including Federal Reserve Chair Jerome Powell, have embarked on the challenging mission of curbing inflationary pressures through heightened interest rates, all the while avoiding economic contraction. This elusive equilibrium, historically challenging to achieve, is what economists fondly term a “soft landing.”
The question that beckons is: are we on the brink of witnessing this rare economic feat?
Historical Context
Historically, efforts to tame inflation with increased interest rates have sometimes led to unintended consequences. Often, rapid rate hikes inadvertently plunge economies into recessions, exacerbating unemployment rates and dampening investment climates. This is because as borrowing becomes expensive, consumers reduce spending and businesses curtail investments, leading to an economic slowdown or even contraction.
Given this background, it’s understandable why the ideal scenario of a soft landing, where price pressures are contained without causing economic downturns, is seen as almost mythical in economic circles.
Indicative Signs
Recent economic data, however, provides a glimmer of hope. A somewhat declining inflation trend coupled with a sustained growth in economic output has sparked optimistic whispers among economists. Here’s why many believe a soft landing might be on the horizon:
Measured Rate Hikes: Under Powell’s stewardship, the Federal Reserve has been cautious, opting for gradual and measured rate increases rather than aggressive jumps. This approach allows the economy to adjust without being jolted abruptly.
Recent News: The Federal Reserve holds interest rates at September meeting
Resilient Consumer Spending: Despite the rate hikes, consumer spending – a significant driver of the U.S. economy – has remained robust. This resilience indicates that the economy still has underlying strength.
Flexible Policy Stance: The Federal Reserve has consistently signaled its readiness to adjust its policies based on evolving economic conditions. This adaptability is crucial in navigating the unpredictable waters of global economics.
Stabilizing External Factors: Global economic conditions, including stabilizing trade relationships and steady growth in emerging markets, have provided a conducive backdrop for the U.S. to manage its internal economic challenges.
Skepticism and Vigilance
While the indicators are promising, it’s worth noting that economic predictions are inherently fraught with uncertainties. There are always external shocks, geopolitical tensions, and unforeseen events that can derail even the most optimistic forecasts. As a result, while there’s growing consensus about the possibility of a soft landing, there’s also a shared understanding of the need for continued vigilance.
Time Will Tell
Achieving a soft landing for the U.S. economy would indeed be a remarkable accomplishment, especially given the historical challenges associated with it. The signs are undeniably encouraging, and under the Fed’s pragmatic leadership, the possibility seems more tangible than ever.
However, in the ever-fluid landscape of global economics, only time will tell whether this optimism translates into a realized economic equilibrium.
-
Optimism Among Small Business Owners Declined in August

According to the NFIB’s Small Business Economic Trends data
The National Federation of Independent Business was founded in 1943 and is the largest small business association in the U.S. The NFIB collects data from small and independent businesses and publishes their Small Business Economic Trends data on the second Tuesday of each month. The Index is a composite of 10 components based on expectations for: employment, capital outlays, inventories, the economy, sales, inventory, job openings, credit, growth and earnings.
Here is what the NFIB released on September 12th:
“NFIB’s Small Business Optimism Index decreased 0.6 of a point in August to 91.3, the 20th consecutive month below the 49-year average of 98. Twenty-three percent of small business owners reported that inflation was their single most important business problem, up two points from last month. The net percent of owners raising average selling prices increased two points to a net 27% (seasonally adjusted), still at an inflationary level.
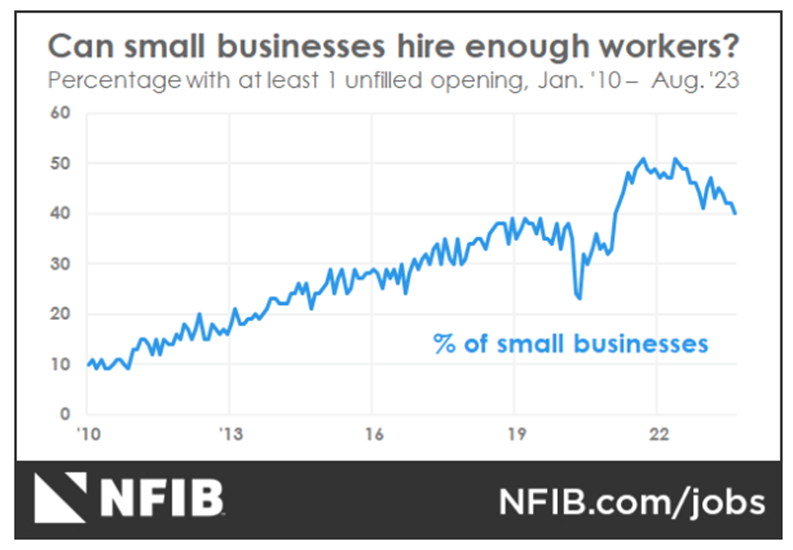
As reported in the NFIB monthly jobs report, 40% (seasonally adjusted) of all owners reported job openings they could not fill in the current period. Owners’ plans to fill open positions remain elevated, with a seasonally adjusted net 17% planning to create new jobs in the next three months.
Related Article: Job Openings Decline in July
Sales Trends
A net negative 14% of all owners (seasonally adjusted) reported higher nominal sales in the past three months, the lowest reading since August 2020. The net percent of owners expecting higher real sales volumes declined two points to a net negative 14%.
The net percent of owners reporting inventory gains declined four points to a net negative 7%. Not seasonally adjusted, 11% reported increases in stocks and 16% reported reductions. A net negative 5% of owners viewed current inventory stocks as “too low” in August, down one point from July. By industry, shortages are the most frequent in retail (9%), finance (7%), manufacturing (7%), and services (7%).
The net percent of owners raising average selling prices increased two points from July to a net 27% (seasonally adjusted). Twenty-three percent of owners reported that inflation was their single most important problem in operating their business, up two points.
Unadjusted, 12% reported lower average selling prices and 38% reported higher average prices. Price hikes were the most frequent in finance (52% higher, 7% lower), construction (51% higher, 6% lower), retail (45% higher, 11% lower), and wholesale (36% higher, 20% lower). Seasonally adjusted, a net 30% plan price hikes.
Raising Compensation
A net 36% reported raising compensation, down two points from July. A net 26% of owners plan to raise compensation in the next three months, up five points.
80% of owners cited labor costs as their top business problem, down two points from July. 24% percent said that labor quality was their top business problem.