-
The Market and Election Cycles
History underscores that shareholders are investing in companies, not a political party
It’s natural for investors to seek a connection between who wins the White House and which was stocks will go. Regardless of who wins, nearly a century of returns shows that stocks have trended upward.
It is also unlikely that making investment decisions based on control of the chambers of Congress will lead to better financial outcomes.
Stocks tend to reward disciplined investors no matter who is President or who controls Congress. This election season, fight the urge to take actions driven by emotions such as fear or greed. Hiring a financial planner can help you stay on track and provide you with well-reasoned advice if and when you become emotional.
Source: https://my.dimensional.com/
-
Optimism Among Small Business Owners Declined in August

According to the NFIB’s Small Business Economic Trends data
The National Federation of Independent Business was founded in 1943 and is the largest small business association in the U.S. The NFIB collects data from small and independent businesses and publishes their Small Business Economic Trends data on the second Tuesday of each month. The Index is a composite of 10 components based on expectations for: employment, capital outlays, inventories, the economy, sales, inventory, job openings, credit, growth and earnings.
Here is what the NFIB released on September 12th:
“NFIB’s Small Business Optimism Index decreased 0.6 of a point in August to 91.3, the 20th consecutive month below the 49-year average of 98. Twenty-three percent of small business owners reported that inflation was their single most important business problem, up two points from last month. The net percent of owners raising average selling prices increased two points to a net 27% (seasonally adjusted), still at an inflationary level.
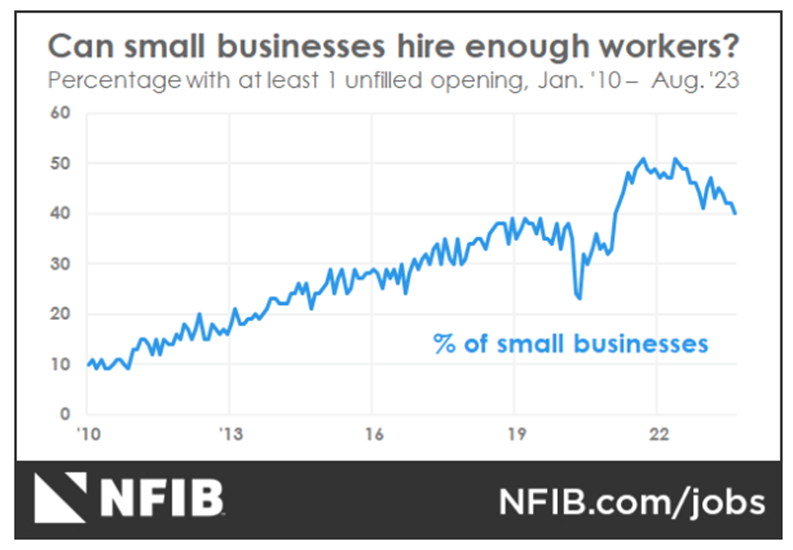
As reported in the NFIB monthly jobs report, 40% (seasonally adjusted) of all owners reported job openings they could not fill in the current period. Owners’ plans to fill open positions remain elevated, with a seasonally adjusted net 17% planning to create new jobs in the next three months.
Related Article: Job Openings Decline in July
Sales Trends
A net negative 14% of all owners (seasonally adjusted) reported higher nominal sales in the past three months, the lowest reading since August 2020. The net percent of owners expecting higher real sales volumes declined two points to a net negative 14%.
The net percent of owners reporting inventory gains declined four points to a net negative 7%. Not seasonally adjusted, 11% reported increases in stocks and 16% reported reductions. A net negative 5% of owners viewed current inventory stocks as “too low” in August, down one point from July. By industry, shortages are the most frequent in retail (9%), finance (7%), manufacturing (7%), and services (7%).
The net percent of owners raising average selling prices increased two points from July to a net 27% (seasonally adjusted). Twenty-three percent of owners reported that inflation was their single most important problem in operating their business, up two points.
Unadjusted, 12% reported lower average selling prices and 38% reported higher average prices. Price hikes were the most frequent in finance (52% higher, 7% lower), construction (51% higher, 6% lower), retail (45% higher, 11% lower), and wholesale (36% higher, 20% lower). Seasonally adjusted, a net 30% plan price hikes.
Raising Compensation
A net 36% reported raising compensation, down two points from July. A net 26% of owners plan to raise compensation in the next three months, up five points.
80% of owners cited labor costs as their top business problem, down two points from July. 24% percent said that labor quality was their top business problem.

-
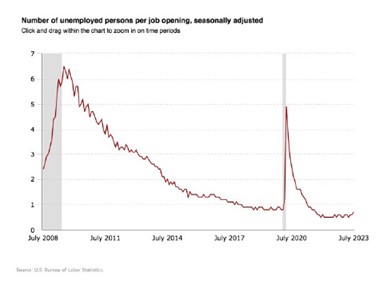
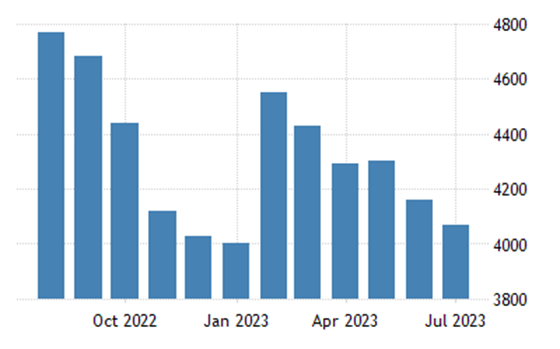
Job Openings Decline in July

The U.S. Bureau of Labor Statistics reported that job openings lowered to 8.8 million
On Tuesday, the number of job openings edged down to 8.8 million on the last business day of July, the U.S. Bureau of Labor Statistics reported. Over the month, the number of hires and total separations changed little at 5.8 million and 5.5 million, respectively. Within separations, quits (3.5 million) decreased, while layoffs and discharges (1.6 million) changed little.
Job Openings
- On the last business day of July, the number of job openings edged down to 8.8 million (-338,000), while the rate changed little at 5.3%.
- Over the month, job openings decreased in professional and business services (-198,000); health care and social assistance (-130,000); state and local government, excluding education (-67,000); state and local government education (-62,000); and federal government (-27,000).
- By contrast, job openings increased in information (+101,000) and in transportation, warehousing, and utilities (+75,000).
Separations
Total separations include quits, layoffs and discharges, and other separations. Quits are generally voluntary separations initiated by the employee. Therefore, the quits rate can serve as a measure of workers’ willingness or ability to leave jobs. Layoffs and discharges are involuntary separations initiated by the employer. Other separations include separations due to retirement, death, disability, and transfers to other locations of the same firm.
The number and rate of total separations in July were little changed at 5.5 million and 3.5%, respectively. Over the month, the number of total separations decreased in accommodation and food services (-132,000).
In July, the number of quits decreased to 3.5 million (-253,000), while the rate changed little at 2.3%. The number of quits declined in accommodation and food services (-166,000); wholesale trade (-27,000); and arts, entertainment, and recreation (-17,000). The number of quits increased in state and local government education (+18,000).
In July, the number of layoffs and discharges changed little at 1.6 million, and the rate held at 1.0%. The number of layoffs and discharges changed little in all industries.
The number of other separations was little changed in July at 378,000.
Establishment Size Class
In July, establishments with 1 to 9 employees saw little change in all data elements. Establishments with more than 5,000 employees had decreases in their quits rates and total separations rates.
-
Existing Home Sales Decline as Inventory and Mortgage Rates Rise

United States Existing Home Sales
On Tuesday, the National Association of Realtors announced that existing-home sales receded in July, Among the four major U.S. regions, sales grew in the West but faded in the Northeast, Midwest and South. All four regions registered year-over-year sales declines.
Total existing home sales completed transactions – that include single-family homes, townhomes, condominiums and co-ops – waned 2.2% from June. Year-over-year, sales slumped 16.6%.
- Total housing inventory registered at the end of July was 1.11 million units, up 3.7% from June but down 14.6% from one year ago (1.3 million).
- Unsold inventory sits at a 3.3-month supply at the current sales pace, up from 3.1 months in June and 3.2 months in July 2022.
- The median existing-home pricefor all housing types in July was $406,700, an increase of 1.9% from July 2022 ($399,000).
- Properties typically remained on the market for 20 days in July, up from 18 days in June and 14 days in July 2022.
- Seventy-four percent of homes sold in July were on the market for less than a month.
30-Year Mortgage Rates Up Over 7%According to Freddie Mac, the 30-year fixed rate mortgage averaged 7.09% as of August 17. That’s up from 6.96% the prior week and 5.13% one year ago.
Single-family and Condo/Co-Op Sales
- Single-family home sales slid in July, down 1.9% from June and 16.3% from the previous year. The median existing single-family home price was $412,300 in July, up 1.6% from July 2022.
- Existing condominium and co-op sales also slid in July, down 4.5% from June and 19.2% from one year ago. The median existing condo price was $357,600 in July, up 4.5% from the previous year ($342,200).
Regional BreakdownExisting-home sales in the Northeast descended 5.9% from June to an annual rate of 480,000 in July, down 23.8% from July 2022. The median price in the Northeast was $467,500, up 5.5% from one year ago.
In the Midwest, existing-home sales decreased by 3.0% from the prior month to an annual rate of 960,000 in July, dropping 20.0% from the previous year. The median price in the Midwest was $304,600, up 3.9% from July 2022.
Existing-home sales in the South retracted 2.6% from June to an annual rate of 1.86 million in July, a decrease of 14.3% from one year ago. The median price in the South was $366,200, up 1.7% from July 2022.
In the West, existing-home sales increased 2.7% from the previous month to an annual rate of 770,000 in July, down 12.5% from the prior year. The median price in the West was $610,500, unchanged from July 2022.
-
EQUITIES ADVANCE LAST WEEK AS THE FED RAISES RATES BY 25 BASIS POINTS
CORPORATE EARNINGS COME IN BETTER THAN EXPECTED
Summary
- The small-cap Russell 2000 (+1.1%) recorded another positive week, followed closely by the S&P 500 (+1.0%) and the DJIA (+0.7%)
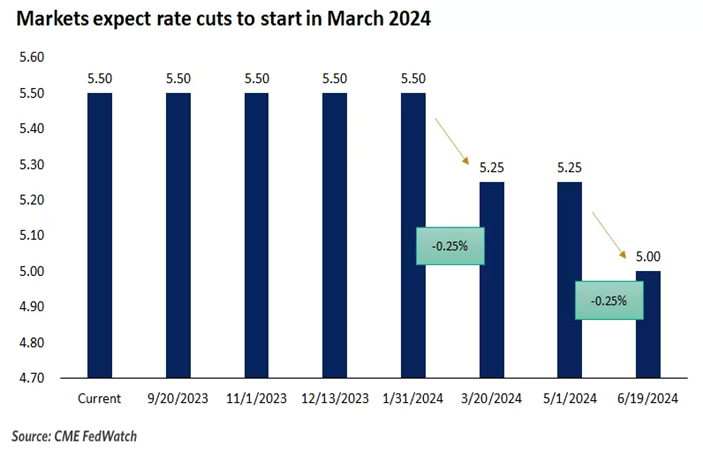
- There was a lot of economic news last week, but by far the biggest news was probably also the most expected, when the Fed voted on Wednesday to raise the target range for the fed funds rate by 25 basis points to 5.25-5.50%
- Surprisingly, Wall Street reacted well to the expected rate hike, on hopes that the Fed is done raising rates for the year, as the CME FedWatch Tool put the probability of a second rate hike any time later this year at less than 30%
- It was a busy earnings week, too, with Microsoft, Google (Alphabet) and Facebook (Meta) all moving decently
- Of the 11 S&P 500 sectors, 9 were positive as the Communication Services led the pack with a whopping 6.9% gain, whereas Utilities and Real Estate dropped by about 2% each
- The 10-year Treasury yield moved up 11 basis points and came to rest at 3.96%, a whisper away from that 4% threshold so important to Wall Street
Weekly Market Update – as of JULY 28, 2023
Close Week YTD DJIA 35,459 +0.7% +7.0% S&P 500 4,582 +1.0% +18.3% NASDAQ 14,317 +2.0% +36.8% Russell 2000 1,982 +1.1% +12.5% MSCI EAFE 2,196 +1.0% +13.0% Bond Index* 2,087.52 -0.35% +1.80% 10-Year Treasury 3.96% +0.11% +0.1% *Source: Bonds represented by the Bloomberg Barclays US Aggregate Bond TR USD.
This chart is for illustrative purposes only and does not represent the performance of any specific security. Past performance cannot guarantee future results
Stocks Advance as Fed Raises Rates
Stocks had a good week, as all four of the major U.S. equity indexes advanced on hopes that a soft landing engineered by the Federal Reserve was becoming real. Most encouraging for investors was the fact that the DJIA saw its 13th consecutive daily gain through Wednesday, marking its longest winning streak since 1987. Growth stocks far outpaced Value stocks, driven by NASDAQ’s 2% gain, which padded its 36%+ YTD gain.
The week’s biggest news was widely anticipated, as the Federal Reserve voted unanimously on Wednesday to raise the fed funds rate by 25 basis points, after pausing last month. Fed Chair Jerome Powell was non-committal about whether rates would be raised further, but he did acknowledge that inflation is far from its most-recent peak. The fed futures market is predicting that there will be about a 30% chance of another rate hike later this year.
There was a lot of economic data received last week and here are a few highlights:
- Q1 GDP revised up significantly;
- New home sales jumped in May;
- New home sales prices declined in May;
- Durable goods orders advanced in May;
- Consumer confidence leapt in July;
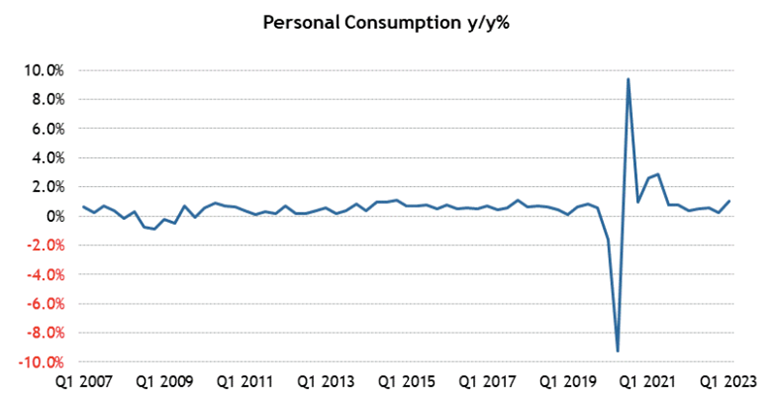
- Personal income increased in May;
- Personal spending rose in May;
- Wages and salaries increased in May;
- Initial jobless claims dropped last week
GDP Revised Up Significantly
The third estimate for Q1 GDP saw a very large, upward revision to 2.0% from 1.3%, as consumer spending proved to be much more robust than anticipated.
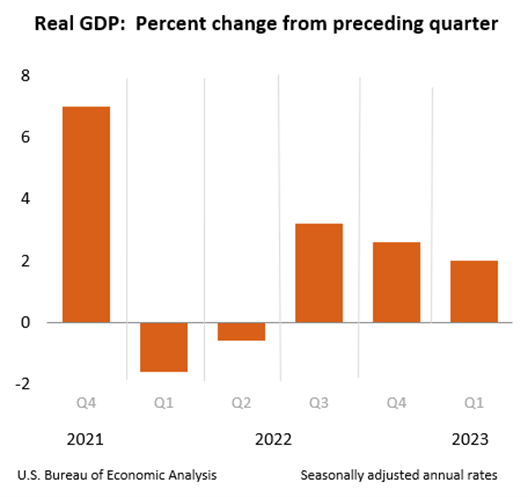
Highlights
- Personal consumption expenditures growth was revised to 4.2% from 3.8%. That contributed 2.79 percentage points to Q1 GDP growth versus the second estimate of 2.52 percentage points.
- Gross private domestic investment declined 11.9%, versus the second estimate of -11.5%, after increasing 4.5% in Q4. This subtracted 2.22 percentage points from GDP growth versus 2.14 percentage points in the second estimate.
- Exports were up 7.8%, versus the second estimate of 5.2%, after declining 3.7% in Q4. Imports were up 2.0%, versus 4.0% in the second estimate, after declining 5.5% in Q4. Net exports contributed 0.58 percentage points to Q1 GDP growth versus the second estimate of 0.00 percentage points.
- Government spending increased 5.0%, versus the second estimate of 5.2%, after increasing 3.8% in Q4. This added 0.85 percentage points to Q1 GDP growth versus 0.89 percentage points in the second estimate.
New Home Sales Jump in May But Sales Prices Decline
New home sales surged 12.2% month-over-month in May to a seasonally adjusted annual rate of 763,000 units. On a year-over-year basis, new home sales were up 20.0%, but the median sales price declined 7.6% year-over-year to $416,300 while the average sales price declined 6.6% to $487,300.
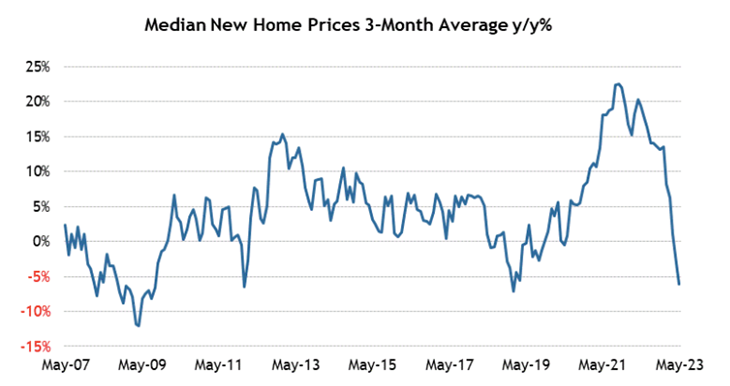
In addition:
- New home sales month-over-month/year-over-year by region:
- Northeast (+17.6%/+110.5%);
- Midwest (+4.1%/+40.0%);
- South (+11.3%/+22.0%);
- West (+17.4%/-0.6%).
- At the current sales pace, the supply of new homes for sale stood at 6.7 months, versus 7.6 months in April and 8.3 months in May 2022.
- The percentage of new homes sold for $399,999 or less accounted for 44% of new homes sold versus 49% in April and 39% one year ago.
Durable Goods Orders Are UP
Total durable goods orders were up 1.7% month-over-month following an upwardly revised 1.2% increase (from 1.1%) in April. Excluding transportation, durable goods orders increased 0.6% month-over-month following a downwardly revised 0.6% decline (from -0.2%) in April.
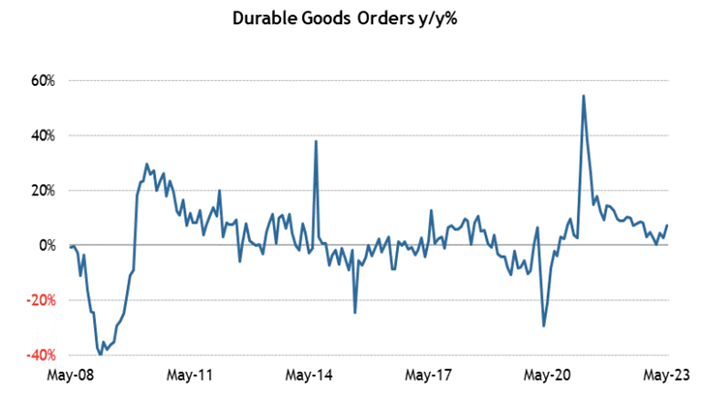
Highlights
- New orders for machinery jumped 1.0% after increasing 0.3% in April.
- New orders for computers and electronic products increased 0.3% after declining 1.8% in April.
- New orders for fabricated metal products were flat after declining 0.2% in April.
- Transportation equipment orders jumped 3.9% after increasing 4.8% in April. New orders for motor vehicles and parts were up 2.2% after being flat in April. New orders for nondefense aircraft and parts rose 32.5% after slipping 2.0% in April.
- Shipments of nondefense capital goods excluding aircraft, which factors into GDP computations, increased 0.2% following a 0.4% increase in April.
Sources: conference-board.org; bea.gov; census.gov; msci.com; fidelity.com; nasdaq.com; wsj.com; morningstar.com
- The small-cap Russell 2000 (+1.1%) recorded another positive week, followed closely by the S&P 500 (+1.0%) and the DJIA (+0.7%)