-
Summer Vacation Budgeting
Tips for Saving Money While Traveling
How You Can Enjoy the Season without Breaking the Bank
Summer is the perfect time to take a break from the daily grind and go on a vacation. However, if you’re not careful, the cost of travel can quickly add up and leave you with a hefty bill. The good news is that with some careful planning and budgeting, you can enjoy a memorable vacation without breaking the bank. Here are some summer vacation budgeting tips for saving money while traveling this summer.
Summer Vacation Budgeting Tip #1: Choose Your Destination Wisely
The first step in saving money on your summer vacation is to choose your destination wisely. Consider destinations that are less popular or off the beaten path, as these are often more affordable. Look for deals on airfare and accommodations and consider traveling during the week instead of on weekends, as this can also save you money.
Summer Vacation Budgeting Tip #2: Set a Budget
Before you start planning your vacation, it’s important to set a budget. Determine how much you can afford to spend on airfare, accommodations, food, and activities, and stick to this budget as closely as possible. Keep in mind that unexpected expenses can arise, so it’s a good idea to set aside some extra money for emergencies.
Summer Vacation Budgeting Tip #3: Look for Deals and Discounts
There are many ways to save money on travel, such as using travel reward points, booking early, and looking for deals and discounts. Consider using a travel rewards credit card to earn points that can be redeemed for airfare or hotel stays. Check with your employer, school, or membership organizations for any travel discounts that may be available. If you’re a veteran, you may qualify for special travel discounts, too.
Related Article: Financial Planning For Recent College Graduates
Summer Vacation Budgeting Tip #4: Plan Your Meals
Eating out at restaurants can be a major expense while traveling. To save money, plan your meals in advance and look for affordable dining options, such as street food or local markets. Consider staying in accommodations that have a kitchen so you can cook some meals yourself.
Summer Vacation Budgeting Tip #5: Choose Free or Low-Cost Activities
One of the best ways to save money while traveling is to choose free or low-cost activities. Look for outdoor activities, such as hiking or biking, that don’t cost anything. Visit local museums or parks that offer free admission or take a self-guided walking tour of the city.
Summer Vacation Budgeting Tip #6: Be Flexible
Finally, be flexible with your travel plans. If you’re willing to travel during off-peak times or stay in less expensive accommodations, you can save a significant amount of money. Consider taking a road trip instead of flying or staying in a vacation rental instead of a hotel.
Are You Financially Prepared for the Summer Season?
For many people, summer is the time to enjoy travel and time off with family and friends. With some careful planning and budgeting, you can enjoy a memorable summer vacation without breaking the bank or veering off the path to achieving your financial goals. By choosing your destination wisely, setting a budget, looking for deals and discounts, planning your meals, choosing free or low-cost activities, and being flexible with your plans, you can save money and have a great time on your summer vacation.
If you’d like to discuss more personal finance tips or create a financial plan, contact Lane Hipple Wealth Management Group at our Moorestown, NJ office by calling 856-249-4342, emailing info@lanehipple.com, or to schedule a complimentary discovery call, use this link to find a convenient time.
Illuminated Advisors is the original creator of the content shared herein. I have been granted a license in perpetuity to publish this article on my website’s blog and share its contents on social media platforms. I have no right to distribute the articles, or any other content provided to me, or my Firm, by Illuminated Advisors in a printed or otherwise non-digital format. I am not permitted to use the content provided to me or my firm by Illuminated Advisors in videos, audio publications, or in books of any kind.
-
Housing Prices Hint at Recovery
All 20 Major Metro Areas Rise in March
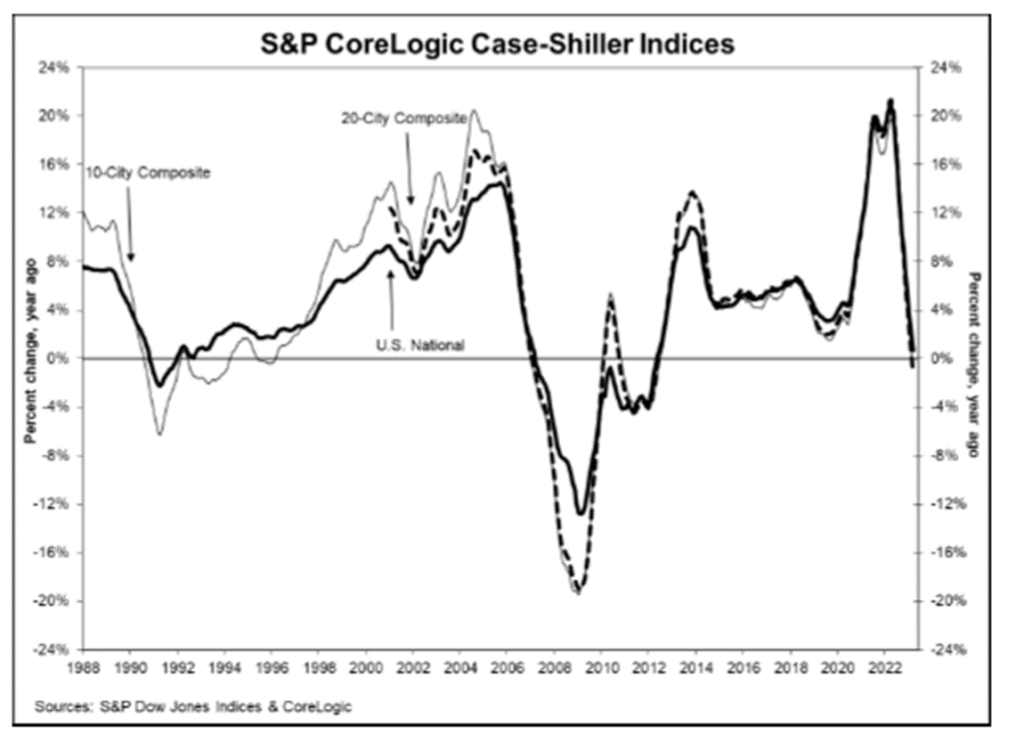
S&P Dow Jones Indices today released the latest results for the S&P CoreLogic Case-Shiller Indices, the leading measure of U.S. home prices. Data released today for March 2023 show a continuing recovery in housing prices, as all 20 major metro markets reported month-over-month price increases.
Month-Over-Month
Before seasonal adjustment, the U.S. National Index posted a 1.3% month-over-month increase in March, while the 10-City and 20-City Composites posted increases of 1.6% and 1.5%, respectively.
After seasonal adjustment, the U.S. National Index posted a month-over-month increase of 0.4%, while the 10-City Composite gained 0.6% and 20-City Composites posted an increase of 0.5%.
Analysis
“The modest increases in home prices we saw a month ago accelerated in March 2023. The National Composite rose by 1.3% in March, and now stands only 3.6% below its June 2022 peak. Our 10- and 20-City Composites performed similarly, with March gains of 1.6% and 1.5% respectively. On a trailing 12-month basis, the National Composite is only 0.7% above its level in March 2022, with the 10- and 20-City Composites modestly negative on a year-over-year basis.
The acceleration we observed nationally was also apparent at a more granular level. Before seasonal adjustment, prices rose in all 20 cities in March (versus in 12 in February), and in all 20 price gains accelerated between February and March. Seasonally adjusted data showed 15 cities with rising prices in March (versus 11 in February), with acceleration in 14 cities.
One of the most interesting aspects of our report continues to lie in its stark regional differences.
Miami’s 7.7% year-over-year gain made it the best-performing city for the eighth consecutive month. Tampa (+4.8%) continued in second place, narrowly ahead of bronze medalist Charlotte (+4.7%). The farther west we look, the weaker prices are, with Seattle (-12.4%) now leading San Francisco (-11.2%) at the bottom of the league table. It’s unsurprising that the Southeast (+5.4%) remains the country’s strongest region, while the West (-6.2%) remains the weakest.
Two months of increasing prices do not a definitive recovery make, but March’s results suggest that the decline in home prices that began in June 2022 may have come to an end. That said, the challenges posed by current mortgage rates and the continuing possibility of economic weakness are likely to remain a headwind for housing prices for at least the next several months.” The chart below depicts the annual returns of the U.S. National, 10-City Composite, and 20-City Composite Home Price Indices.”

Sources: spglobal.com
-
Financial Planning for Recent College Graduates
Six Steps to Prepare for Long-Term Success
Graduating from college is a major milestone, but it can also be a daunting time for many young adults as they transition into the “real world”. If you have a recent college graduate in your life, they may be facing a number of financial challenges, from student loan debt to finding their first job. Financial planning may be the last thing on their mind, but you can use your influence and experience to help them see the benefit of taking financial planning steps as a recent college graduate in order to set themselves up for long-term success.
Share the six steps below to help them get started.
Financial Planning for Recent College Graduates Tip #1: Create a Budget
The first step in any financial plan is to create a budget. Don’t think of it as something that constrains you. Rather, consider your budget a tool to balance spending on needs and wants, and to help you achieve your goals. Creating a budget helps you understand where your money is going and where you can make adjustments to save more. Start by listing all of your monthly income and expenses, including rent, utilities, groceries, transportation, and any debt payments, such as student loans. Then, look for areas where you can cut back, such as eating out less or finding a more cost-effective apartment. Be sure to set aside some money each month for savings, as well. (More on that below.)
Financial Planning for Recent College Graduates Tip #2: Make a Plan to Pay Off Student Loans
Student loan debt is a major concern for many recent college graduates. If you have student loans, make a plan to pay them off as quickly as possible. Consider consolidating your loans or refinancing them to get a lower interest rate. You may also want to explore income-driven repayment plans, which can reduce your monthly payments based on your income.
Financial Planning for Recent College Graduates Tip #3: Start Saving for Retirement Now
It’s never too early to start saving for retirement – even if you’re in your early twenties. When you begin your first professional job, be sure to take advantage of your employer’s 401(k). If they don’t offer one or you dislike the plan details, you can also open your own individual retirement account (IRA). The earlier you start saving, the more time your money has to grow. Your future self will thank you!
Related Article: How Inflation Impacts Wealth Management and Investment Strategies
Financial Planning for Recent College Graduates Tip #4: Plan to Navigate Rainy Days
Life is unpredictable, and you never know when you might face an unexpected expense or job loss. That’s why it’s important to build an emergency fund so you won’t be forced into debt on rainy days – or seasons of life. Aim to save three to six months’ worth of living expenses in a separate savings account. This will give you a financial cushion in case of an emergency, and it will give you peace of mind, too.
Financial Planning for Recent College Graduates Tip #5: Understand and Protect Your Credit Score
Your credit score is an important factor in many financial decisions, such as getting a loan or renting an apartment. Make sure you understand what affects your credit score, such as paying bills on time and keeping your credit card balances low. It’s important to protect your credit score, too, so check your report regularly to make sure there are no errors or fraudulent activity. Check out this resource from the Consumer Financial Protection Bureau to learn more.
Financial Planning for Recent College Graduates Tip #6: Set Financial Goals
Another important step in financial planning for anyone – recent college graduates included – is to set financial goals. These could be anything from saving for a down payment on a house to paying off your student loans by a certain date. Having clear goals will help you stay motivated and focused on your financial plan.
Recent College Graduates Should Begin Financial Planning Now
Graduating from college is a big win and something to be proud of. It’s also a time of significant transition for many people, and it’s important to start off on the right foot financially in order to protect your future. Use the six steps above to take control of your finances now and set yourself up for long-term financial success.
If you’d like to discuss financial planning for recent college graduates, contact Lane Hipple Wealth Management Group at our Moorestown, NJ office by calling 856-452-8026, emailing info@lanehipple.com, or to schedule a complimentary discovery call, use this link to find a convenient time.
Illuminated Advisors is the original creator of the content shared herein. I have been granted a license in perpetuity to publish this article on my website’s blog and share its contents on social media platforms. I have no right to distribute the articles, or any other content provided to me, or my Firm, by Illuminated Advisors in a printed or otherwise non-digital format. I am not permitted to use the content provided to me or my firm by Illuminated Advisors in videos, audio publications, or in books of any kind.
-
Market Insights
Sales of New Single-Family Houses Are Up While Building Permits Are Not
The U.S. Census Bureau and the U.S. Department of Housing and Urban Development jointly announced the following new residential sales statistics for April 2023:
- Sales of new single‐family houses in April 2023 were at a seasonally adjusted annual rate of 683,000.
- This is 4.1% above the revised March rate of 656,000.
- This is 11.8% above the April 2022 estimate of 611,000.
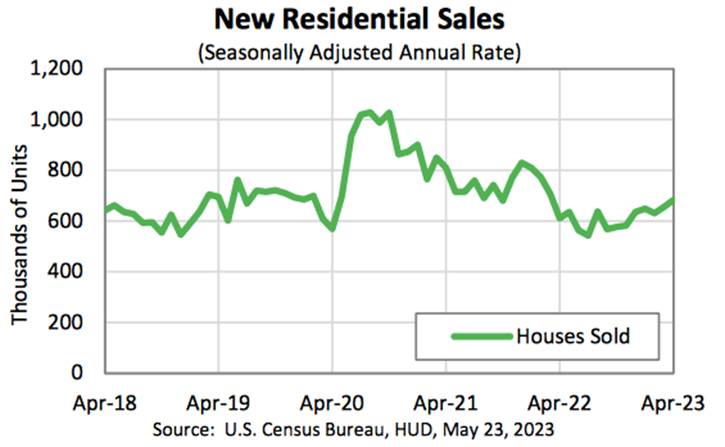
- The median sales price of new houses sold in April 2023 was $420,800.
- The average sales price was $501,000.
- This represents a supply of 7.6 months at the current sales rate.
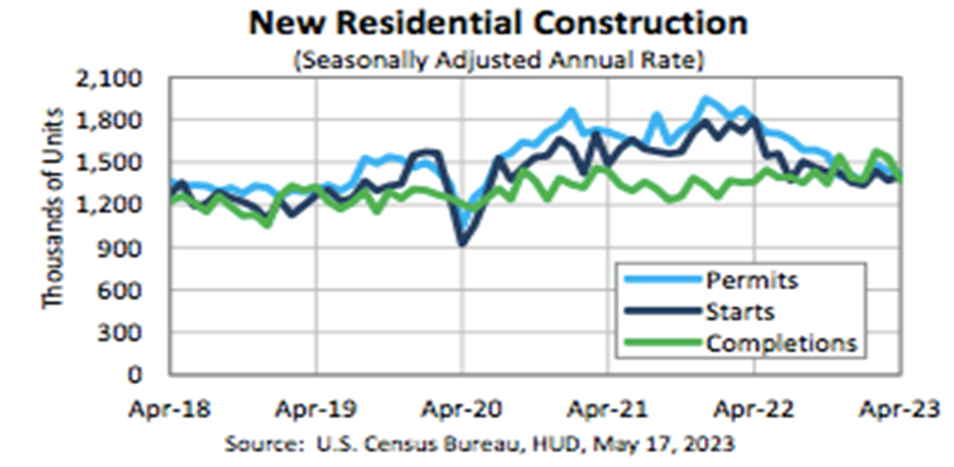
Residential Construction
Today’s release is on the heels of the following new residential construction statistics for April 2023:
Building Permits
- Privately‐owned housing units authorized by building permits in April were at an annual rate of 1,416,000.
- This is 1.5% below March and is 21.1% below the April 2022 rate.
- Single‐family authorizations in April were at a rate of 855,000. This is 3.1% above the March figure.
Housing Starts
- Privately‐owned housing starts in April were at an annual rate of 1,401,000. This is 2.2% above March but is 22.3% below the April 2022 rate.
- Single‐family housing starts in April were at a rate of 846,000. This is 1.6% above March.
Housing Completions
- Privately‐owned housing completions in April were at an annual rate of 1,375,000. This is 10.4% below March, but is 1.0% above the April 2022 rate.
- Single‐family housing completions in April were at a rate of 971,000 This is 6.5% below the March rate.
Sources: census.gov
-
Lane Hipple Sponsors 2nd Annual Noelle’s Light Golf Classic
The charity event helped raise over $70,000
The mission of Noelle’s Light is to deliver financial support to distressed families that are receiving treatment & care following a life-threatening fetal diagnosis. Their efforts are dedicated to uplifting families during their time of need. Eligible families can receive up to $5,000 in financial assistance to cover unexpected out-of-pocket expenses.
On Monday, May 22nd, partners and employees of Lane Hipple participated in a golf tournament at Riverton Country Club in Cinnaminson, New Jersey to raise awareness and to support this important and impactful cause. For the second consecutive year, we joined founders Jodi and Alex Laughlin along with many others to help continue their efforts to support families in need through financial assistance, mentorship, and social networking.
Left: Chief Operating Officer Mike Stringer, Managing Partner Thomas Lane, Jr., Financial Planner Gregory Reading, and Partner Thomas Lane, III.
Right: Gregory Reading accepts the first place trophy from Noelle’s Light Co-Founder Alex Laughlin
More About Noelle’s Light
Noelle’s Light, Inc. is a New Jersey non-profit corporation whose mission is to provide financial support to distressed families that are receiving treatment and care following a life-threatening fetal diagnosis.
The organization was incorporated in December 2017 and began operating in 2019 after receiving its federal recognition as a tax-exempt public charity under US Internal Revenue Code 501(c)(3).
Noelle’s Light is co-founded by parents Jodi & Alex Laughlin, who lost their infant daughter in 2016 due to complications from a rare fetal condition. They emerged from their experience with the perspective that most families are financially unequipped to navigate the costs a life-threatening diagnosis.
The organization is rooted in hope, compassion, and the duty we all have to help others in their time of need.