-
Inflation Was Up 0.5% in January and 6.4% Over the Past 12-Months

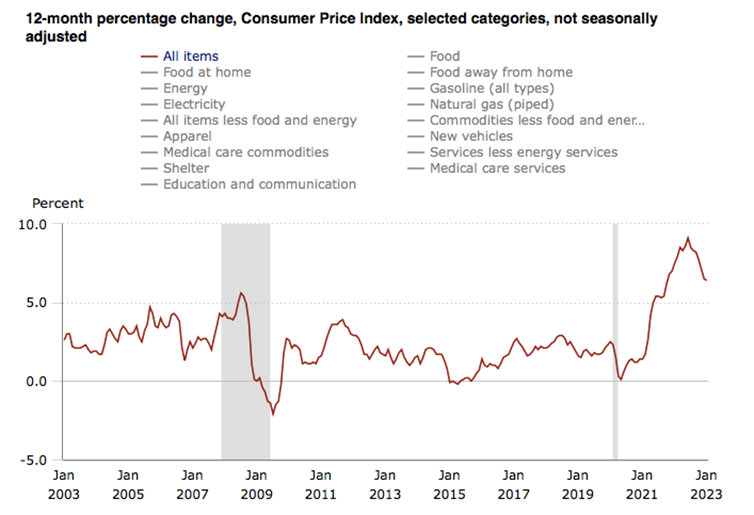
On Tuesday, the U.S. Bureau of Labor Statistics reported that the Consumer Price Index for All Urban Consumers (CPI-U) rose 0.5% in January on a seasonally adjusted basis, after increasing 0.1% in December. Over the last 12 months, the all items index increased 6.4% before seasonal adjustment.

Specifically:
- The index for shelter was by far the largest contributor to the monthly all items increase, accounting for nearly half of the monthly all items increase, with the indexes for food, gasoline, and natural gas also contributing.
- The food index increased 0.5% over the month with the food at home index rising 0.4%.
- The energy index increased 2.0% over the month as all major energy component indexes rose over the month.
The index for all items less food and energy rose 0.4% in January. Categories which increased in January include the shelter, motor vehicle insurance, recreation, apparel, and household furnishings and operations indexes. The indexes for used cars and trucks, medical care, and airline fares were among those that decreased over the month.
The all items index increased 6.4% for the 12 months ending January; this was the smallest 12-month increase since the period ending October 2021. The all items less food and energy index rose 5.6% over the last 12 months, its smallest 12-month increase since December 2021. The energy index increased 8.7% for the 12 months ending January, and the food index increased 10.1%.
Items of Note January 2023 12-Months Ended January 2023 All Items 0.5% 6.4% Food 0.5% 10.1% Energy 2.0% 8.7% Fuel Oil -1.2% 27.7% Utility (piped) gas service 6.7% 26.7% Used cars and trucks -1.9% -11.6% Shelter 0.7% 7.9% Inflation Over the Past 20-Years
Sources: bls.gov

-
2022 Goods and Services Deficit Increased By $103 Billion From 2021

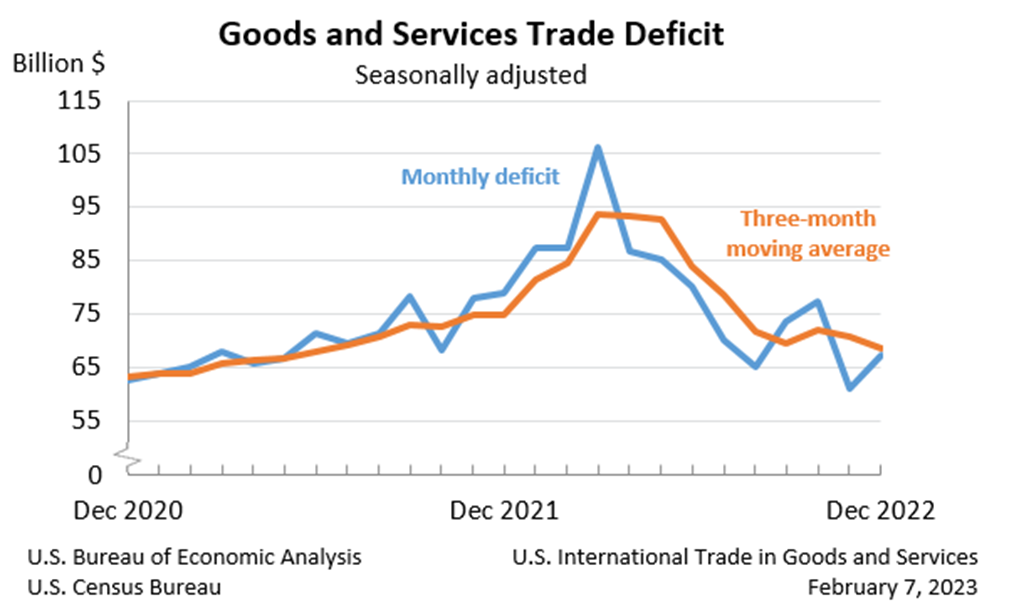
On Tuesday, the U.S. Census Bureau and the U.S. Bureau of Economic Analysis announced that the goods and services deficit was $67.4 billion in December, up $6.4 billion from $61.0 billion in November.
December exports were $250.2 billion, $2.2 billion less than November exports. December imports were $317.6 billion, $4.2 billion more than November imports.
The December increase in the goods and services deficit reflected an increase in the goods deficit of $7.4 billion to $90.6 billion and an increase in the services surplus of $1.0 billion to $23.2 billion.
For 2022, the goods and services deficit increased $103.0 billion, or 12.2%, from 2021. Exports increased $453.1 billion or 17.7%. Imports increased $556.1 billion or 16.3%.
Three-Month Moving Averages
The average goods and services deficit decreased $2.1 billion to $68.6 billion for the three months ending in December.
- Average exports decreased $2.6 billion to $253.0 billion in December.
- Average imports decreased $4.7 billion to $321.6 billion in December.
Year-over-year, the average goods and services deficit decreased $6.4 billion from the three months ending in December 2021.
- Average exports increased $24.2 billion from December 2021.
- Average imports increased $17.8 billion from December 2021.
Exports of Goods
- Nonmonetary gold decreased $1.6 billion.
- Crude oil decreased $0.8 billion.
- Other petroleum products decreased $0.6 billion.
- Jewelry decreased $0.4 billion.
- Pharmaceutical preparations decreased $0.2 billion.
- Foods, feeds, and beverages increased $0.7 billion.
Imports of Goods
- Cell phones and other household goods increased $3.5 billion.
- Automotive vehicles, parts, and engines increased $2.9 billion.
- Passenger cars increased $1.6 billion.
- Other automotive parts and accessories increased $0.7 billion.
- Fuel oil decreased $0.8 billion.
- Organic chemicals decreased $0.8 billion.
Sources: bea.gov
-
Manufacturers in Texas Saw Growth in Factory Activity Slow in January

Every month, the Federal Reserve Bank of Dallas asks Texas business executives questions on labor market conditions and the results are compiled into the Texas Manufacturing Outlook Survey, the Texas Service Sector Outlook Survey and the Texas Retail Outlook Survey.
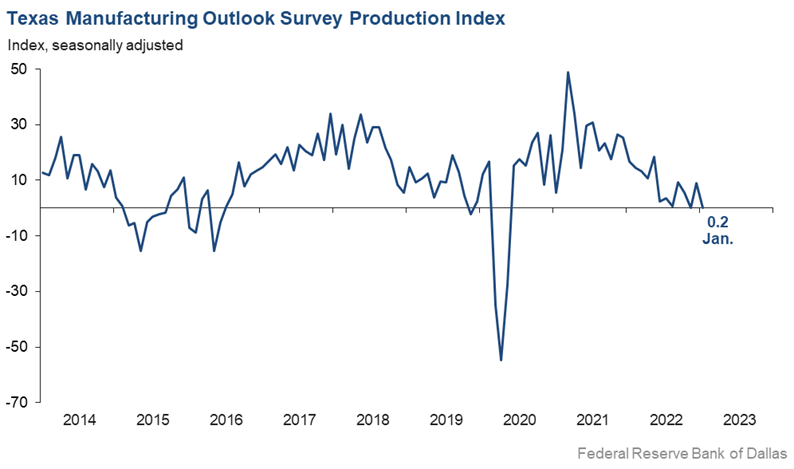
On January 30th, the Federal Reserve Bank of Dallas reported that: “Growth in Texas factory activity slowed in January, according to business executives responding to the Texas Manufacturing Outlook Survey. The production index, a key measure of state manufacturing conditions, fell from 9.1 to 0.2, with the near-zero reading suggestive of flat output.
Other measures generally indicated weakened manufacturing activity this month. The new orders index was negative for an eighth month in a row – suggesting a continued decrease in demand – though it moved up from -11.0 to -4.0. The growth rate of orders index inched down to -12.3. The capacity utilization index was positive but dipped from 7.9 to 6.0, while the shipments index returned to negative territory at a reading of -6.3.
Perceptions of broader business conditions continued to worsen in January, though pessimism waned. The general business activity index remained negative but shot up 12 points to -8.4. Similarly, the company outlook index posted its 11th straight negative reading but moved up 11 points to -2.5. The outlook uncertainty index was largely unchanged at 16.8.
Labor Market & Price Pressures
Labor market measures pointed to stronger employment growth and longer workweeks.
- The employment index climbed four points to 17.6, a reading significantly above its series average of 7.9.
- Thirty-one percent of firms noted net hiring, while 13 percent noted net layoffs.
- The hours worked index held fairly steady at 3.8.
Further, price pressures were generally steady and wage growth eased slightly in January.
- The raw materials prices index was largely stable at 20.5, remaining below its series average of 28.0 for the third month in a row.
- The finished goods prices index was little changed at 9.9, roughly in line with its series average of 9.0.
- The wages and benefits index ticked down from 34.2 to 30.5.
Expectations regarding future manufacturing activity were mixed in January. The future production index pushed further positive to 16.1, signaling that respondents expect output growth over the next six months. The future general business activity index remained negative, coming in at -9.1. Most other measures of future manufacturing activity were positive this month.”
Sources: dallasfed.org

-
Conference Board Leading & Coincident Economic Indicators Pointing to a Recession

The Conference Board was founded in 1916 by a group of CEOs “concerned about the impact of workplace issues on business, and with a desire for greater cooperation and knowledge sharing among businesses.”
Every month, the Conference Board compiles a composite of economic indexes designed to signal peaks and troughs in the business cycle. The leading, coincident, and lagging economic indexes are essentially composite averages of 10 individual indicators and help smooth out some of the volatility of individual components.
The ten components include:
- Average weekly hours, manufacturing
- Average weekly initial claims for unemployment insurance
- Manufacturers’ new orders, consumer goods and materials
- ISM Index of New Orders
- Manufacturers’ new orders, nondefense capital goods excluding aircraft orders
- Building permits, new private housing units
- Stock prices, 500 common stocks
- Leading Credit Index
- Interest rate spread, 10-year Treasury bonds less federal funds
- Average consumer expectations for business conditions
Leading Indicators Signaling a Recession
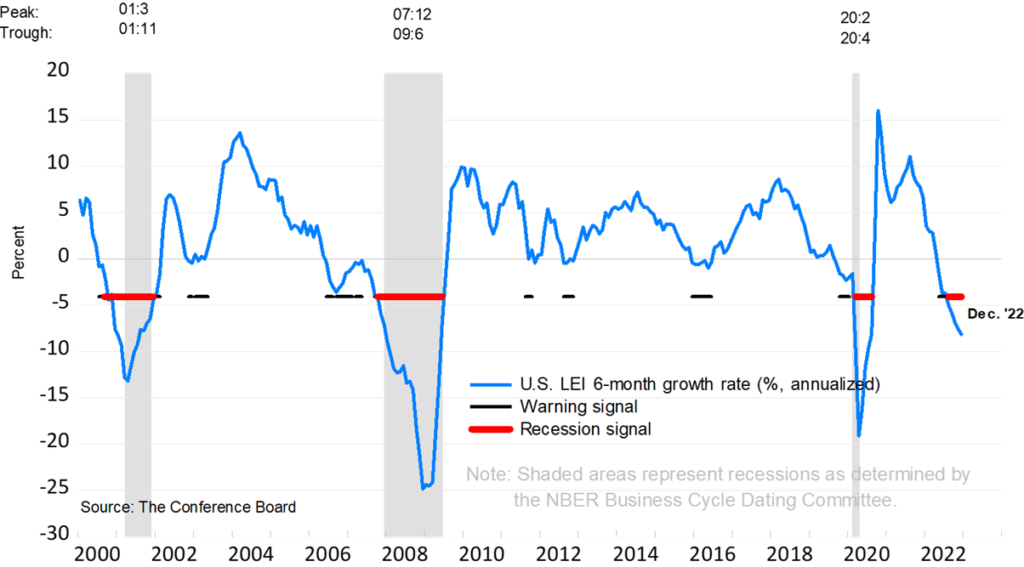
On January 23rd, the Conference Board announced that its Leading Economic Index for the U.S. decreased by 1.0% in December 2022 to 110.5 (2016=100), following a decline of 1.1% in November.
The LEI is now down 4.2% over the six-month period between June and December 2022 – a much steeper rate of decline than its 1.9% contraction over the previous six-month period (December 2021–June 2022).
“The US LEI fell sharply again in December – continuing to signal recession for the US economy in the near term. There was widespread weakness among leading indicators in December, indicating deteriorating conditions for labor markets, manufacturing, housing construction, and financial markets in the months ahead.
Meanwhile, the coincident economic index (CEI) has not weakened in the same fashion as the LEI because labor market related indicators (employment and personal income) remain robust. Nonetheless, industrial production – also a component of the CEI – fell for the third straight month.
Overall economic activity is likely to turn negative in the coming quarters before picking up again in the final quarter of 2023.”
The trajectory of the US LEI continues to signal a recession
Sources: conference-board.org
-
Small Business Optimism Drops Amidst Continued Inflation Challenges

The National Federation of Independent Business was founded in 1943 and is the largest small business association in the U.S. The NFIB collects data from small and independent businesses and publishes their Small Business Economic Trends data on the second Tuesday of each month. The Index is a composite of 10 components based on expectations for: employment, capital outlays, inventories, the economy, sales, inventory, job openings, credit, growth and earnings.
Here is what the Small Business Economic Trends data released on January 10th reported:
The NFIB Small Business Optimism Index declined 2.1 points in December to 89.8, marking the 12th consecutive month below the 49-year average of 98. Owners expecting better business conditions over the next six months worsened by eight points from November to a net negative 51%. Inflation remains the single most important business problem with 32% of owners reporting it as their top problem in operating their business.
“Overall, small business owners are not optimistic about 2023 as sales and business conditions are expected to deteriorate. Owners are managing several economic uncertainties and persistent inflation and they continue to make business and operational changes to compensate.”
Key findings include:
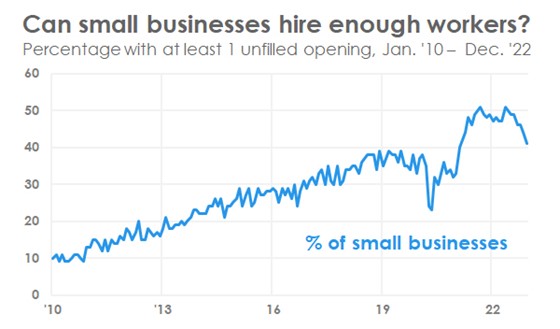
- Forty-one percent of owners reported job openings that were hard to fill, down three points from November but historically very high.
- The net percent of owners raising average selling prices decreased eight points to a net 43% (seasonally adjusted), historically high.
- The net percent of owners who expect real sales to be higher worsened two points from November to a net negative 10%.
More Small Business Woes
As reported in the NFIB’s monthly jobs report:
- Owners’ plans to add positions remain elevated, with a seasonally adjusted net 17% planning to create new jobs in the next three months.
- Overall, 55% of owners reported hiring or trying to hire in December.
- Ninety-three percent of those hiring or trying to hire reported few or no qualified applicants for the positions they were trying to fill.
Further:
- A net 44% of owners reported raising compensation.
- A net 27% plan to raise compensation in the next three months, down one point from November.
- 8% of owners cited labor costs as their top business problem.
- 23% said that labor quality was their top business problem.
More Data Later This Week
More economic data will be released later this week, including MBA Mortgage Applications on Wednesday; Jobless Claims and CPI data on Thursday; and Consumer Sentiment on Friday.
Sources: nfib.com
- Forty-one percent of owners reported job openings that were hard to fill, down three points from November but historically very high.