-
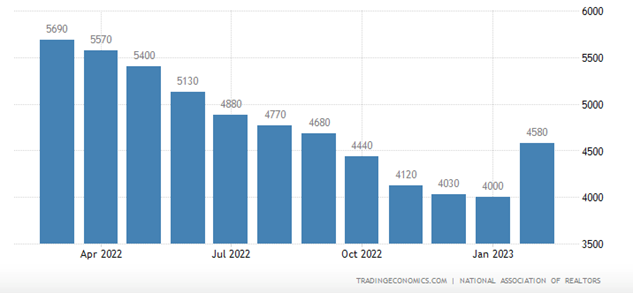
Existing Home Sales Jump in February as Median Home Prices Slide for the First Time in Almost 11 Years

On Tuesday, the National Association of Realtors reported that “existing-home sales reversed a 12-month slide in February, registering the largest monthly percentage increase since July 2020. Month-over-month sales rose in all four major U.S. regions. All regions posted year-over-year declines.
- Total existing-home sales completed transactions that include single-family homes, townhomes, condominiums and co-ops – vaulted 14.5% from January to a seasonally adjusted annual rate of 4.58 million in February.
- Year-over-year, sales fell 22.6% (down from 5.92 million in February 2022).
- Total housing inventory registered at the end of February was 980,000 units, identical to January and up 15.3% from one year ago (850,000).
- Unsold inventory sits at a 2.6-month supply at the current sales pace, down 10.3% from January but up from 1.7 months in February 2022.”
Existing Home Sales
Median Prices Slide After 131 Months of Gains
- “The median existing-home price for all housing types in January was $363,000, a decline of 0.2% from February 2022 ($363,700), as prices climbed in the Midwest and South yet waned in the Northeast and West.
- This ends a streak of 131 consecutive months of year-over-year increases, the longest on record.
- Properties typically remained on the market for 34 days in February, up from 33 days in January and 18 days in February 2022.
- Fifty-seven percent of homes sold in February were on the market for less than a month.
- First-time buyers were responsible for 27% of sales in February, down from 31% in January and 29% in February 2022.
- All-cash sales accounted for 28% of transactions in February, down from 29% in January but up from 25% in February 2022.
- Distressed sales – foreclosures and short sales – represented 2% of sales in February, nearly identical to last month and one year ago.
Regional Breakdown
- Existing-home sales in the Northeast improved 4.0%, down 25.7% from February 2022. The median price in the Northeast was $366,100, down 4.5% from the previous year.
- In the Midwest, existing-home sales grew 13.5%, declining 18.7% from one year ago. The median price in the Midwest was $261,200, up 5.0% from February 2022.
- Existing-home sales in the South rebounded 15.9% in February, a 21.3% decrease from the prior year. The median price in the South was $342,000, an increase of 2.7% from one year ago.
- In the West, existing-home sales rocketed 19.4% in February, down 28.3% from the previous year. The median price in the West was $541,100, down 5.6% from February 2022.”
Sources: nar.realtor

- Total existing-home sales completed transactions that include single-family homes, townhomes, condominiums and co-ops – vaulted 14.5% from January to a seasonally adjusted annual rate of 4.58 million in February.
-
Markets Mixed as Growth and Tech Names Jump on Hopes That the Fed Might Have Reached an Inflection Point on Hiking Rates

- This week was dominated by banking worries that started with the collapse of Silicon Valley Bank last week and spread to Signature Bank of New York and a few others this week
- But before markets opened on Monday, Wall Street learned through a joint statement from the Federal Reserve, Treasury, and the FDIC that all depositors at SVB and Signature Bank would be able to access deposits on Monday, despite being taken over by regulators
- When Friday’s final Wall Street bell rung, equity returns were mixed, as the small-cap Russell 2000 lost 2.6%, pushing it into the red for the year (YTD: -2.0%) and the mega-cap DJIA lost 0.1%, pushing it further into the red for the year (YTD: -3.9%)
- The tech-heavy NASDAQ, on the other hand, leapt an astonishing 4.4%, as investors hoped that the Fed’s rate hiking might slow down or be over for the year
- The large-cap S&P 500 inched up 1.4% and is positive for the year (YTD: +2.0%)
- Of the 11 S&P 500 sectors, 6 were positive, with the growth sectors, especially Communication Services (+6.9%) and Information Technology (+5.7%), outpacing the defensive sectors like Utilities (+3.9%) and Consumer staples (+1.3%)
- The 2-year Treasury yield sank 77 basis points to 3.82% and the 10-year Treasury note yield fell 29 basis points to 3.40%
- Oil prices dropped 13.5% this week to $66.33/barrel, the lowest level since December 2021
Weekly Market Update – March 17, 2023
Close Week YTD DJIA 31,862 -0.1% -3.9% S&P 500 3,917 +1.4% +2.0% NASDAQ 11,631 +4.4% +11.0% Russell 2000 1,726 -2.6% -2.0% MSCI EAFE 1,986 -3.5% +2.2% Bond Index* 2,090.71 +1.75% +2.04% 10-Year Treasury 3.41% -0.29% -0.5% *Source: Bonds represented by the Bloomberg Barclays US Aggregate Bond TR USD.
This chart is for illustrative purposes only and does not represent the performance of any specific security. Past performance cannot guarantee future resultsMarkets Mixed as Bank-Failure-Worries Ease
It was another volatile week for equity markets around the world, as pressures mounted on the banking sector as concerns grew after the failures of Silicon Valley Bank and Signature Bank and worries at First Republic Bank and Credit Suisse.
And while pundits were quick to call attention to the big bank failures of 2008/2009, this week was different as governments (including the Fed, the Federal Deposit Insurance Corporation, and the Treasury Department) and other well-capitalized banks stepped in quickly to put worries at ease.
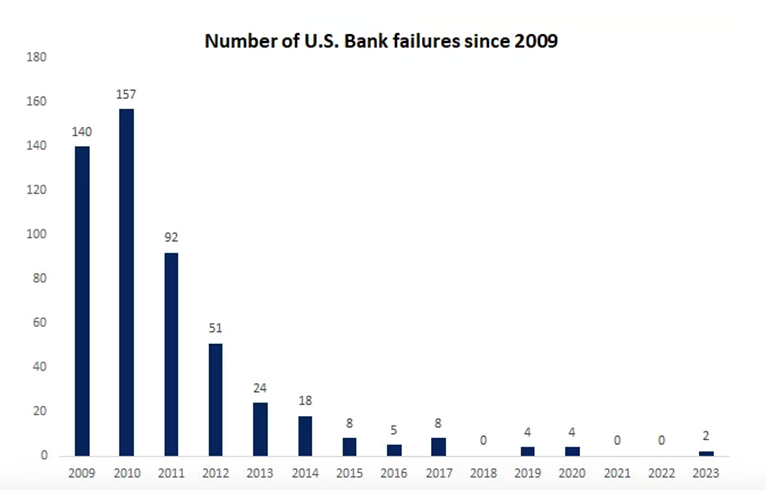
Source: FDIC Then as bond yields dropped swiftly, equities rebounded, giving investors a good case of whiplash. When the week ended, the major U.S. equity indices finished mixed, as the current banking worries might ultimately end up as an inflection point where the Fed slows down or even pauses future rate hikes this year.
Not surprisingly, the 11 S&P 500 sectors varied markedly, with 5 of the 11 ending the week in the red. Specifically, Communication Services (+6.9%) and Information Technology (+5.7%) made big weekly jumps and Financials (-4.9%) and Energy (-6.9%) struggled with big losses. The range in sector returns was further underscored as Large Growth outperformed Large Value by almost 6%.
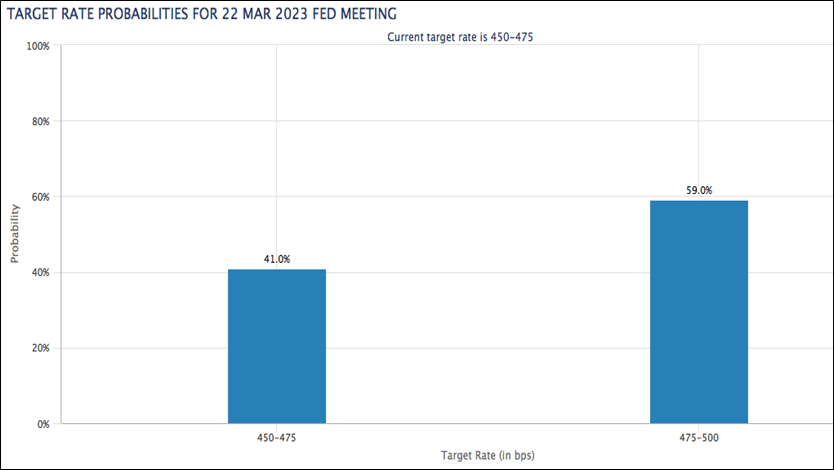
While the bank failures were unpleasant, glass-half-full investors were hopeful that the Fed might adjust its monetary policy and not raise rates by as much. By the end of the week, the fed fund futures markets were pricing in zero likelihood of a 50-basis-point hike versus a 40% chance just one week ago and an almost 40% chance of no rate hike at the Fed’s upcoming meeting on March 21st.
While it seemed everyone was focused on the latest banking news, there was a lot of economic data this week too, including:
- The Consumer Price Index was was up 0.4% month-over-month in February, and up 6.0% year-over-year, which was the smallest 12-month increase since September 2021
- Core CPI, which excludes food and energy, was up 0.5% month-over-month and up 5.5% year-over-year, which was the smallest 12-month increase since December 2021
- The February NFIB Small Business Optimism Index came in at 90.9
- Weekly MBA Mortgage Applications Index were up 6.5%
- February Retail Sales were down 0.4%
- February Retail Sales ex-autos were down 0.1%
- February PPI was down 0.1%
- February Core PPI was flat at 0.0%
- January Business Inventories were down 0.1%
- Weekly Initial Claims came in at 192,000
- February Import Prices were down 0.1%
- February Export Prices were up 0.2%
- Leading Indicators fell 0.3% in February
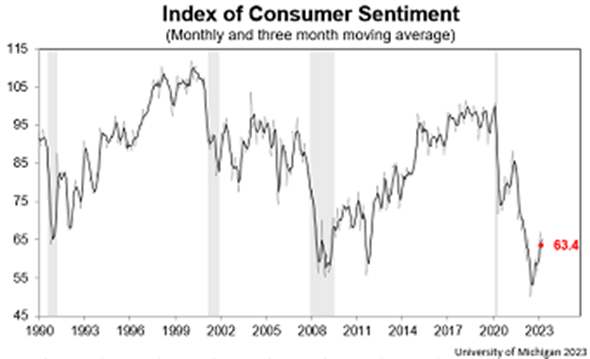
- The preliminary University of Michigan Consumer Sentiment Index for March dropped to 63.4
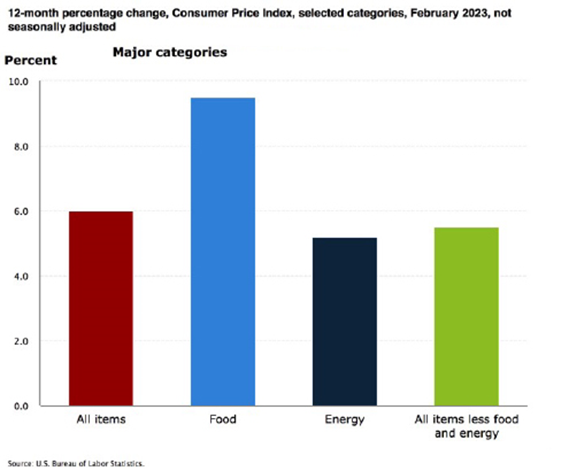
Consumer Price Index Records Smaller Increase, But Food Index is Up 9.5% Over the Last Year
On Tuesday, the U.S. Bureau of Labor Statistics reported that the Consumer Price Index for All Urban Consumers rose 0.4% in February, after increasing 0.5% in January. Over the last 12 months, the all items index increased 6.0% before seasonal adjustment.
Specifically:
- The index for shelter was the largest contributor to the monthly all items increase, accounting for over 70% of the increase, with the indexes for food, recreation, and household furnishings and operations also contributing.
- The food index increased 0.4% over the month with the food at home index rising 0.3%.
- The energy index decreased 0.6% over the month as the natural gas and fuel oil indexes both declined.
- Categories which increased in February include shelter, recreation, household furnishings and operations, and airline
fares. - The index for used cars and trucks and the index for medical care were among those that decreased over the month.
Inflation Over the Past 12-Month
The all items index increased 6.0% for the 12 months ending February; this was the smallest 12-month increase since the period ending September 2021.
- The all items less food and energy index rose 5.5% over the last 12 months, its smallest 12-month increase since December 2021.
- The energy index increased 5.2% for the 12 months ending February.
- The food index increased 9.5% over the last year.
Food Index
- The food index increased 0.4% in February, and the food at home index rose 0.3% over the month. Five of the six major grocery store food group indexes increased over the month. The index for nonalcoholic beverages increased 1.0% in February, after a 0.4% increase the previous month. The indexes for other food at home and for cereals and bakery products each rose 0.3% over the month. The index for fruits and vegetables increased 0.2% in February, and the index for dairy and related products rose 0.1%.
- In contrast, the meats, poultry, fish, and eggs index fell 0.1 percent over the month, the first decrease in that index since December 2021. The index for eggs fell 6.7% in February following sharp increases in recent months.
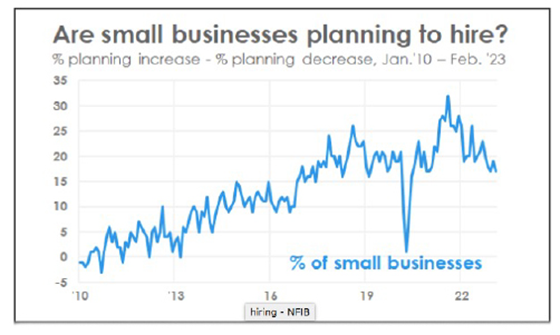
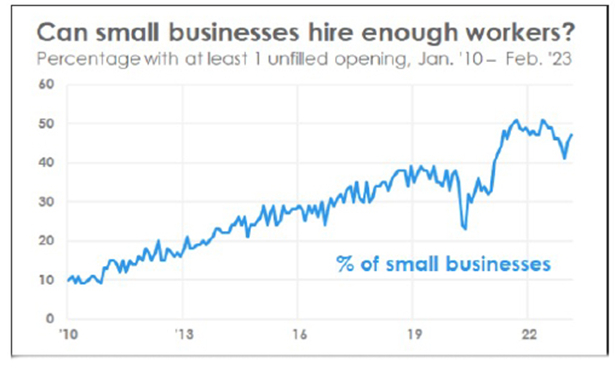
Nearly Half of Small Businesses Have Job Openings They Can’t Fill
Early in the week, the National Federation of Independent Businesses reported that 47% of small business owners reported job openings they could not fill in the current period.
Specifically, “[t]he percent of small business owners reporting labor quality as their top small business operating problem remains elevated at 21%, down three points from January. Labor cost reported as the single most important problem to business owners increased two points to 12%, down one point below the highest reading of 13% reached in December 2021.
A seasonally adjusted net 17% of owners are planning to create new jobs in the next three months, down two points from January and 15 points below its record high reading of 32 reached in August 2021, showing that the trend in planned hiring is on the decline.
Sixty percent of owners reported hiring or trying to hire in January, up three points from January. Of those hiring or trying to hire, 90% of owners reported few or no qualified applicants for the positions they were trying to fill. Thirty percent of owners reported few qualified applicants for their open positions.
Further:
- 46% of owners reported raising compensation, unchanged from last month.
- 23% plan to raise compensation in the next three months, up one point from January.
- 38% of owners have job openings for skilled workers.
- 19% have openings for unskilled labor.
Sources: bls.gov; nfib.com; msci.com; fidelity.com; nasdaq.com; wsj.com; morningstar.com
- This week was dominated by banking worries that started with the collapse of Silicon Valley Bank last week and spread to Signature Bank of New York and a few others this week
-
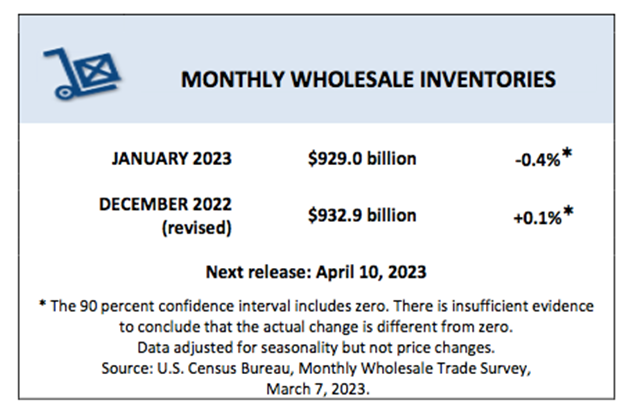
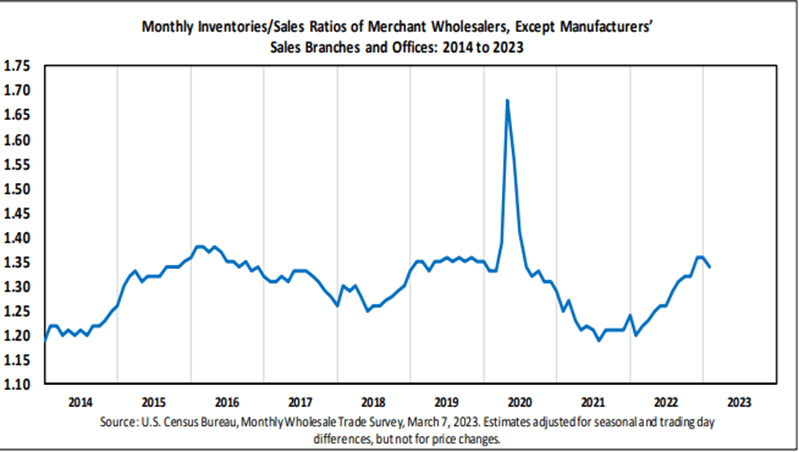
U.S. Wholesale Inventories Fell in January for the First Time Since July 2020

Still Up 15.8% Since January 2022
On Tuesday, the U.S. Census Bureau announced the following new wholesale trade statistics for January 2023:
Sales
- January 2023 sales of merchant wholesalers, except manufacturers’ sales branches and offices, were $693.8 billion, up 1.0% from the December level and up 3.6% from the January 2022 level.
- The November 2022 to December 2022 % change was revised from the preliminary estimate of virtually unchanged to down 0.2%.
Inventories
- Total inventories of merchant wholesalers, except manufacturers’ sales branches and offices were $929.0 billion at the end of January, down 0.4% from the December level.
- Total inventories were up 15.8% from the January 2022 level.
- The December 2022 to January 2023 % change was unrevised from the advance estimate of down 0.4%.
Inventories/Sales Ratio
- The January inventories/sales ratio for merchant wholesalers, except manufacturers’ sales branches and offices was 1.34.
- The January 2022 ratio was 1.20.
Wholesale Inventories – Last 20 Years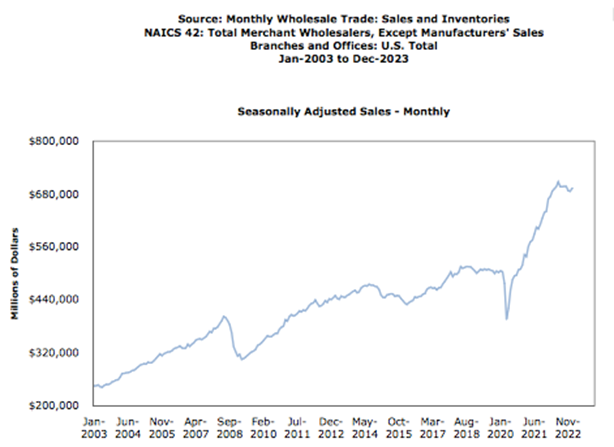
Sources: census.gov

-
Durable Goods Orders Sink by 4.5%

On Tuesday, the U.S. Census Bureau announced the January advance report on durable goods manufacturers’ shipments, inventories and orders:
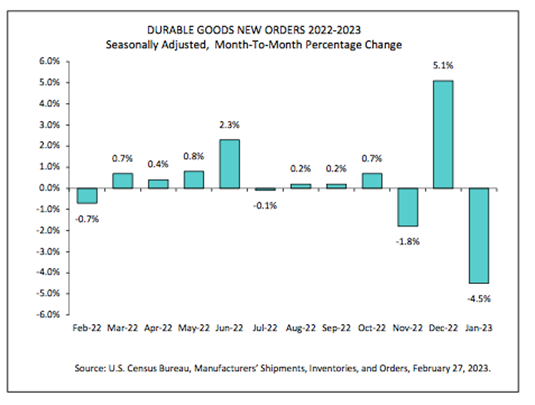
New Orders
- New orders for manufactured durable goods in January, down two of the last three months, decreased $13.0 billion or 4.5% to $272.3 billion. This followed a 5.1% December increase.
- Excluding transportation, new orders increased 0.7%. Excluding defense, new orders decreased 5.1%.
- Transportation equipment, also down two of the last three months, drove the decrease, $14.2 billion or 13.3% to $92.8 billion.
Shipments
Shipments of manufactured durable goods in January, down following sixteen consecutive monthly increases, decreased $0.2 billion or 0.1% to $277.2 billion. This followed a 0.4% December increase. Transportation equipment, down following ten consecutive monthly increases, drove the decrease, $1.6 billion or 1.7% to $92.2 billion.
Unfilled Orders
Unfilled orders for manufactured durable goods in January, up twenty-nine consecutive months, increased $0.3 billion or virtually unchanged to $1,157.0 billion. This followed a 1.1% December increase. Transportation equipment, up twenty-three of the last twenty-four months, drove the increase, $0.7 billion or 0.1% to $684.6 billion.
Inventories
Inventories of manufactured durable goods in January, down following twenty-three consecutive monthly increases, decreased $0.4 billion or 0.1% to $493.1 billion. This followed a 0.7% December increase. Transportation equipment, down following two consecutive monthly increases, led the decrease, $0.3 billion or 0.2% to $158.3 billion.
Capital Goods
Nondefense new orders for capital goods in January decreased $15.2 billion or 15.3% to $83.9 billion. Shipments decreased $0.8 billion or 1.0% to $84.3 billion. Unfilled orders decreased $0.4 billion or 0.1% to $664.1 billion. Inventories decreased $0.5 billion or 0.2% to $218.5 billion. Defense new orders for capital goods in January increased $0.6 billion or 3.8% to $15.8 billion. Shipments decreased $0.2 billion or 1.2% to $14.9 billion. Unfilled orders increased $0.9 billion or 0.5% to $189.2 billion. Inventories increased $0.2 billion or 0.9% to $23.2 billion.
Sources: census.gov
-
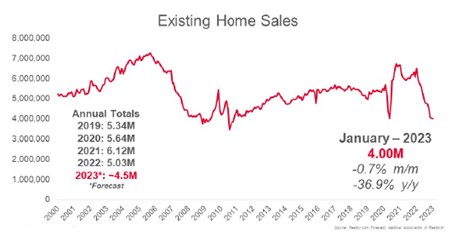
Existing Home Sales Drop for 12th Straight Month, Lowest Since 2010

On Tuesday, the National Association of Realtors reported that existing-home sales fell for the 12th straight month in January. In addition, month-over-month sales were mixed among the four major U.S. regions, as the South and West registered increases, while the East and Midwest experienced declines. All regions recorded year-over-year declines.
Housing Highlights
- Existing-home sales waned for the twelfth consecutive month to a seasonally adjusted annual rate of 4.00 million. Sales slipped 0.7% from December 2022 and 36.9% from the previous year.
- The median existing-home sales price increased 1.3% from one year ago to $359,000.
- The inventory of unsold existing homes grew from the prior month to 980,000 at the end of January, or the equivalent of 2.9 months’ supply at the current monthly sales pace.
Bottoming Out?
“Home sales are bottoming out. Prices vary depending on a market’s affordability, with lower-priced regions witnessing modest growth and more expensive regions experiencing declines. Inventory remains low, but buyers are beginning to have better negotiating power.
Homes sitting on the market for more than 60 days can be purchased for around 10% less than the original list price.”
- The median existing-home pricefor all housing types in January was $359,000, an increase of 1.3% from January 2022 ($354,300), as prices climbed in three out of four U.S. regions while falling in the West.
- This marks 131 consecutive months of year-over-year increases, the longest-running streak on record.
- Properties typically remained on the market for 33 days in January, up from 26 in December and 19 in January 2022. 54% of homes sold in January were on the market for less than a month.
Location, Location, Location- Existing-home sales in the Northeast retracted 3.8% from December, down 35.9% from January 2022. The median price in the Northeast was $383,000, up 0.3% from the previous year.
- In the Midwest, existing-home sales slid 5.0% from the previous month, declining 33.3% from one year ago. The median price in the Midwest was $252,300, up 2.7% from January 2022.
- Existing-home sales in the South rose 1.1% in January from December, a 36.6% decrease from the prior year. The median price in the South was $332,500, an increase of 3.4% from one year ago.
- In the West, existing-home sales elevated 2.9% in January, down 42.4% from the previous year. The median price in the West was $525,200, down 4.6% from January 2022.
Sources: nar.realtor
Copyright © 2023 MainStreet Journal. All rights reserved
Distributed by Financial Media Exchange.