-
Housing Prices Hint at Recovery
All 20 Major Metro Areas Rise in March
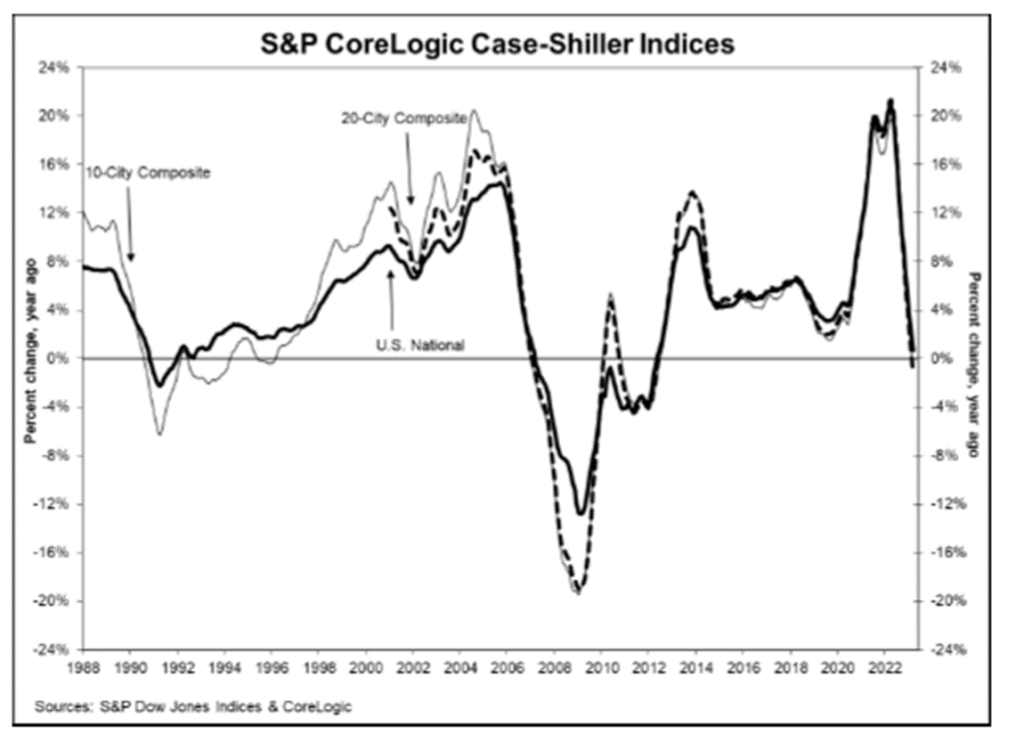
S&P Dow Jones Indices today released the latest results for the S&P CoreLogic Case-Shiller Indices, the leading measure of U.S. home prices. Data released today for March 2023 show a continuing recovery in housing prices, as all 20 major metro markets reported month-over-month price increases.
Month-Over-Month
Before seasonal adjustment, the U.S. National Index posted a 1.3% month-over-month increase in March, while the 10-City and 20-City Composites posted increases of 1.6% and 1.5%, respectively.
After seasonal adjustment, the U.S. National Index posted a month-over-month increase of 0.4%, while the 10-City Composite gained 0.6% and 20-City Composites posted an increase of 0.5%.
Analysis
“The modest increases in home prices we saw a month ago accelerated in March 2023. The National Composite rose by 1.3% in March, and now stands only 3.6% below its June 2022 peak. Our 10- and 20-City Composites performed similarly, with March gains of 1.6% and 1.5% respectively. On a trailing 12-month basis, the National Composite is only 0.7% above its level in March 2022, with the 10- and 20-City Composites modestly negative on a year-over-year basis.
The acceleration we observed nationally was also apparent at a more granular level. Before seasonal adjustment, prices rose in all 20 cities in March (versus in 12 in February), and in all 20 price gains accelerated between February and March. Seasonally adjusted data showed 15 cities with rising prices in March (versus 11 in February), with acceleration in 14 cities.
One of the most interesting aspects of our report continues to lie in its stark regional differences.
Miami’s 7.7% year-over-year gain made it the best-performing city for the eighth consecutive month. Tampa (+4.8%) continued in second place, narrowly ahead of bronze medalist Charlotte (+4.7%). The farther west we look, the weaker prices are, with Seattle (-12.4%) now leading San Francisco (-11.2%) at the bottom of the league table. It’s unsurprising that the Southeast (+5.4%) remains the country’s strongest region, while the West (-6.2%) remains the weakest.
Two months of increasing prices do not a definitive recovery make, but March’s results suggest that the decline in home prices that began in June 2022 may have come to an end. That said, the challenges posed by current mortgage rates and the continuing possibility of economic weakness are likely to remain a headwind for housing prices for at least the next several months.” The chart below depicts the annual returns of the U.S. National, 10-City Composite, and 20-City Composite Home Price Indices.”

Sources: spglobal.com
-
Market Insights
Sales of New Single-Family Houses Are Up While Building Permits Are Not
The U.S. Census Bureau and the U.S. Department of Housing and Urban Development jointly announced the following new residential sales statistics for April 2023:
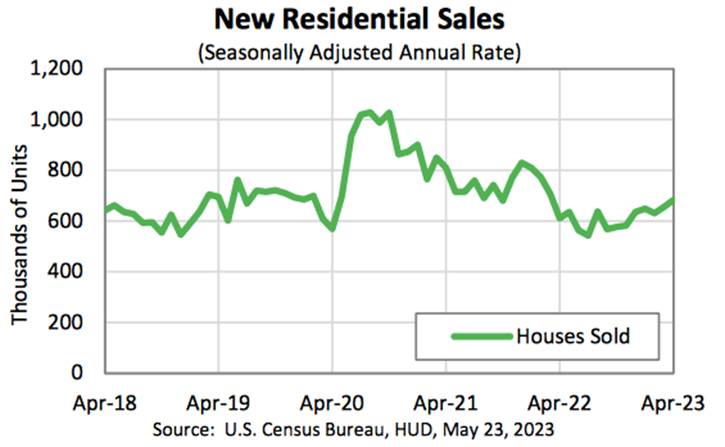
- Sales of new single‐family houses in April 2023 were at a seasonally adjusted annual rate of 683,000.
- This is 4.1% above the revised March rate of 656,000.
- This is 11.8% above the April 2022 estimate of 611,000.
- The median sales price of new houses sold in April 2023 was $420,800.
- The average sales price was $501,000.
- This represents a supply of 7.6 months at the current sales rate.
Residential Construction
Today’s release is on the heels of the following new residential construction statistics for April 2023:
Building Permits
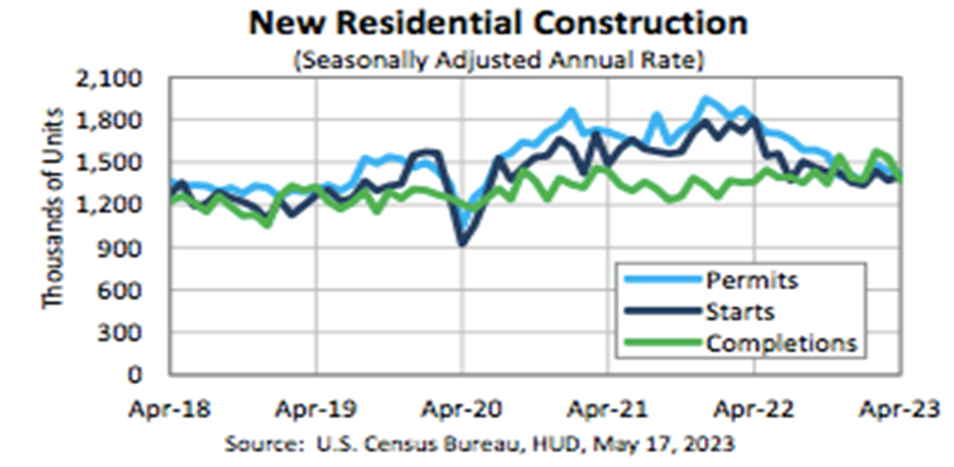
- Privately‐owned housing units authorized by building permits in April were at an annual rate of 1,416,000.
- This is 1.5% below March and is 21.1% below the April 2022 rate.
- Single‐family authorizations in April were at a rate of 855,000. This is 3.1% above the March figure.
Housing Starts
- Privately‐owned housing starts in April were at an annual rate of 1,401,000. This is 2.2% above March but is 22.3% below the April 2022 rate.
- Single‐family housing starts in April were at a rate of 846,000. This is 1.6% above March.
Housing Completions
- Privately‐owned housing completions in April were at an annual rate of 1,375,000. This is 10.4% below March, but is 1.0% above the April 2022 rate.
- Single‐family housing completions in April were at a rate of 971,000 This is 6.5% below the March rate.
Sources: census.gov

-
Retail Sales Up 0.4% in April and Up 1.6% Over April 2022
Plus Interesting Highlights from 2021 Retail Sales
The U.S. Census Bureau conducts the Advance Monthly Retail Trade and Food Services Survey to provide an early estimate of monthly sales by kind of business for retail and food service firms located in the United States.
Each month, questionnaires are mailed to a probability sample of approximately 4,800 employer firms selected from the larger Monthly Retail Trade Survey.
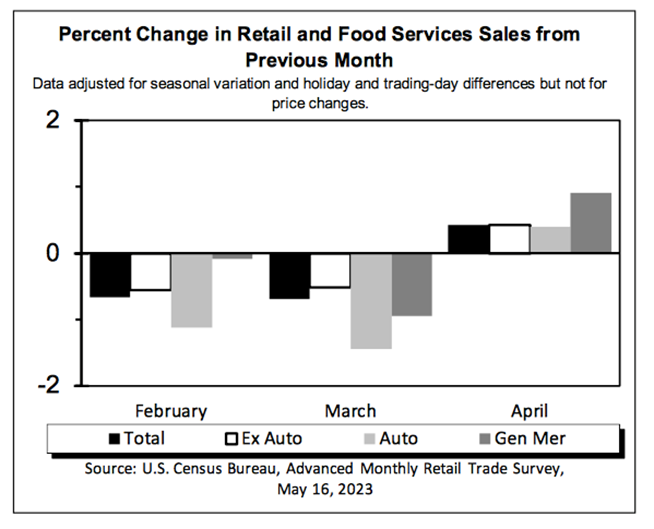
Retail Sales Up in April 2023On Tuesday, the U.S. Census Bureau announced the following advance estimates of U.S. retail and food services sales for April 2023 adjusted for seasonal variation and holiday and trading-day differences, but not for price changes, were $686.1 billion, up 0.4% from the previous month, and up 1.6% above April 2022.
Further:
- Total sales for the February 2023 through April 2023 period were up 3.1% from the same period a year ago.
- The February 2023 to March 2023 percent change was revised from down 0.6% to down 0.7%.
- Retail trade sales were up 0.4% from March 2023, and up 0.5% above last year.
- Nonstore retailers were up 8.0% from last year
- Food services and drinking places were up 9.4% from April 2022.
Highlights From Total U.S. Retail Sales in 2021
- Retail sales for the nation increased 17.1%, from $5,572.0 billion in 2020 to $6,522.6 billion in 2021.
- Men’s clothing stores had $8.3 billion in sales in 2021, up 59.1% from 2020.
- Motor Vehicle and Parts Dealers’ sales increased 22.8%, from $1,208.2 billion in 2020 to $1,484.1 billion in 2021.
- Grocery Store sales increased 4.3%, from $759.4 billion in 2020 to $792.3 billion in 2021.
- Gasoline Station sales increased 32.6%, from $426.9 billion in 2020 to $566.1 billion in 2021.
- Electronic shopping and mail-order houses sales increased 15.4%, from $891.1 billion in 2020 to $1,028.0 billion in 2021.
Sources: census.gov

- Total sales for the February 2023 through April 2023 period were up 3.1% from the same period a year ago.
-
National Vacancy Rates Higher Versus This Time Last Quarter and Last Year
The U.S. Census Bureau announced the following residential vacancies and homeownership statistics for the first quarter 2023:
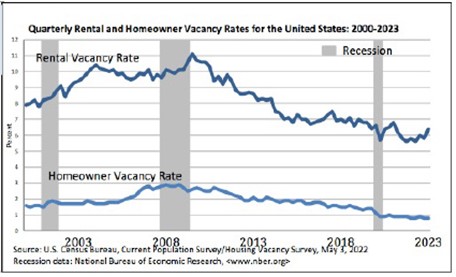
- National vacancy rates in the first quarter 2023 were 6.4% for rental housing and 0.8% for homeowner housing.
- The rental vacancy rate was higher than the rate in the first quarter 2022 (5.8%) and higher than the rate in the fourth quarter 2022 (5.8%).
- The homeowner vacancy rate of 0.8% was virtually the same as the rate in the first quarter 2022 (0.8%) and virtually the same as the rate in the fourth quarter 2022 (0.8%).
- The homeownership rate of 66.0% was not statistically different from the rate in the first quarter 2022 (65.4%) and not statistically different from the rate in the fourth quarter 2022 (65.9%).
- In the first quarter 2023, the median asking rent for vacant for rent units was $1,462.
- In the first quarter 2023, the median asking sales price for vacant for sale units was $319,000.
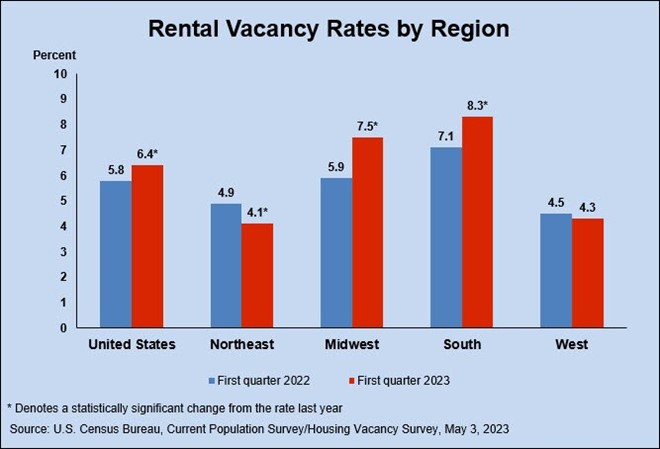
- Approximately 89.6% of the housing units in the United States in the first quarter 2023 were occupied and 10.4% were vacant.
- Owner-occupied housing units made up 59.1% of total housing units, while renter-occupied units made up 30.5% of the inventory in the first quarter 2023.
- Vacant year-round units comprised 7.9% of total housing units, while 2.5% were vacant for seasonal use.
- Approximately 2.1% of the total units were vacant for rent, 0.5% were vacant for sale only and 0.6% were rented or sold but not yet occupied.
- Vacant units that were held off market comprised 4.8% of the total housing stock – 1.5% were for occasional use, 0.8% were temporarily occupied by persons with usual residence elsewhere (URE) and 2.5% were vacant for a variety of other reasons.
Sources: census.gov

- National vacancy rates in the first quarter 2023 were 6.4% for rental housing and 0.8% for homeowner housing.
-
Number of Job Openings Drops for 3rd Month to Lowest Level in 2 Years
The number of job openings decreased to 9.6 million on the last business day of March, according to the U.S. Bureau of Labor Statistics. Over the month, the number of hires and total separations were little changed at 6.1 million and 5.9 million, respectively. Within separations, quits (3.9 million) changed little, while layoffs and discharges (1.8 million) increased. This release includes estimates of the number and rate of job openings, hires, and separations for the total nonfarm sector, by industry, and by establishment size class.
Job Openings
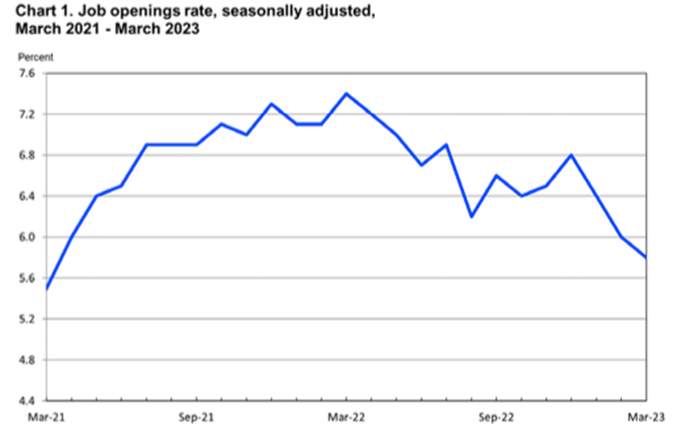
On the last business day of March, the number of job openings decreased to 9.6 million (-384,000) and was 1.6 million lower than in December. The job openings rate was 5.8% in March and was down by 1.0 percentage point since December. In March, job openings decreased in transportation, warehousing, and utilities (-144,000) but increased in educational services (+28,000).
Hires
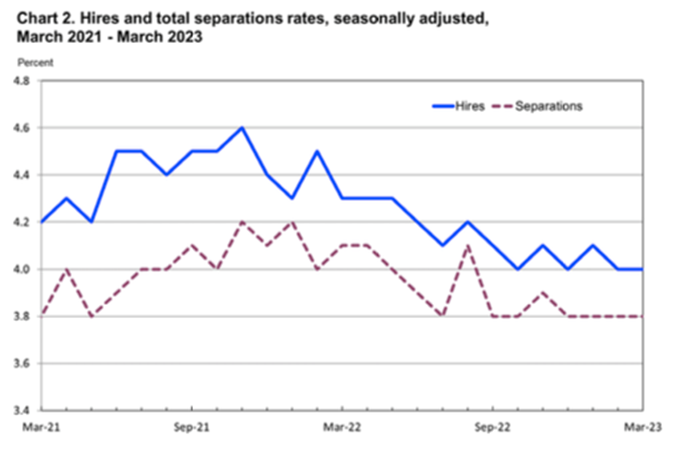
In March, the number of hires was little changed at 6.1 million, and the rate held at 4.0%. Hires decreased in real estate and rental and leasing (-29,000).
Separations
The number of total separations changed little at 5.9 million in March, and the rate was 3.8% for the fourth month in a row. Over the month, the number of total separations decreased in accommodation and food services (-107,000) but increased in construction (+104,000).
In March, the number and rate of quits changed little at 3.9 million and 2.5%, respectively. The number of quits decreased in accommodation and food services (-178,000). In March, the number and rate of layoffs and discharges increased to 1.8 million (+248,000) and 1.2%, respectively. Layoffs and discharges increased in construction (+112,000), accommodation and food services (+63,000), and health care and social assistance (+42,000).
The number of other separations was little changed in March at 276,000. Other separations decreased in finance and insurance (-31,000) and in real estate and rental and leasing (-7,000).
Sources: bls.gov
