-
Mortgage Applications Drop as Mortgage Rates Increase

Mortgage Applications Drop as Mortgage Rates Increase
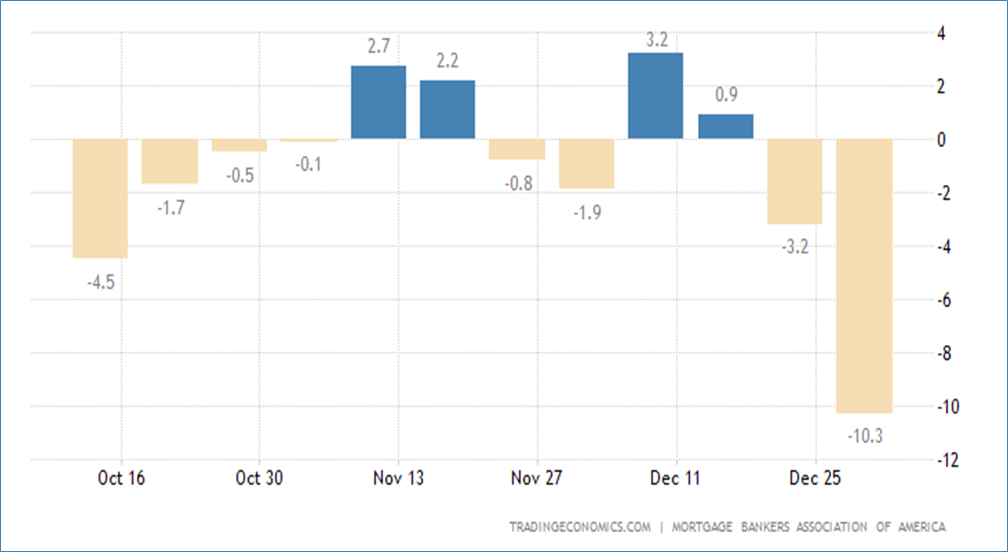
On Wednesday, the Mortgage Bankers Association announced that mortgage applications decreased 13.2% from two weeks earlier (and include adjustments to account for the holidays).
- The Market Composite Index, a measure of mortgage loan application volume, decreased 13.2% on a seasonally adjusted basis from two weeks earlier.
- On an unadjusted basis, the Index decreased 39.4% compared with the two weeks ago.
- The holiday adjusted Refinance Index decreased 16.3% from the two weeks ago and was 87% lower than the same week one year ago.
- The seasonally adjusted Purchase Index decreased 12.2% from two weeks earlier.
- The unadjusted Purchase Index decreased 38.5% compared with the two weeks ago and was 42% lower than the same week one year ago.
“The end of the year is typically a slower time for the housing market, and with mortgage rates still well above 6% and the threat of a recession looming, mortgage applications continued to decline over the past two weeks to the lowest level since 1996. Purchase applications have been impacted by slowing home sales in both the new and existing segments of the market. Even as home-price growth slows in many parts of the country, elevated mortgage rates continue to put a strain on affordability and are keeping prospective home buyers out of the market.”
- The refinance share of mortgage activity increased to 30.3% of total applications from 28.8% the previous week.
- The adjustable-rate mortgage (ARM) share of activity decreased to 7.3% of total applications.
- The FHA share of total applications increased to 14.0% from 13.1% the week prior.
- The VA share of total applications increased to 13.4% from 12.0% the week prior.
- The USDA share of total applications remained unchanged at 0.6%.
MBA Mortgage Applications Over the Past Year
Increases to Mortgage Rates
- The average contract interest rate for 30-year fixed-rate mortgages with conforming loan balances ($647,200 or less) increased to 6.58% from 6.42%, with points increasing to 0.73 from 0.65 (including the origination fee) for 80% loan-to-value ratio (LTV) loans. The effective rate increased from last week.
- The average contract interest rate for 30-year fixed-rate mortgages with jumbo loan balances (greater than $647,200 ) remained at 6.12%, with points increasing to 0.45 from 0.37 (including the origination fee) for 80% LTV loans. The effective rate increased from last week.
- The average contract interest rate for 15-year fixed-rate mortgages increased to 6.06% from 5.97%, with points increasing to 0.70 from 0.57 (including the origination fee) for 80% LTV loans. The effective rate increased from last week.
Sources: mba.org
- The Market Composite Index, a measure of mortgage loan application volume, decreased 13.2% on a seasonally adjusted basis from two weeks earlier.
-
S&P 500 Sector Performance for November 2022

As volatility declined,
all 11 S&P 500 sectors advanced for the monthOver every single time period, sector performance will be driven largely by factors one would expect, such as the overall state of the economy, underlying corporate earnings, current and predicted interest rates, and inflation, among other factors.
Reviewing the sector performance for the month of November (a very short time-period), two things become very clear:
- First, sectors do not move in lock-step with one another and will often provide very divergent returns for investors – depending on timing and the current economic climate and
- Second, November continued to see very real divergence in sector performance, with the spread between the best (+10%) and the worst (+0.11%) being unusually wide.
Sector Highlights Through November 2022
For the month of November, sector performance was excellent, as all 11 sectors advanced healthily. For the month of October, sector performance was very good, as 9 of the 11 sectors were up for the month, with 7 up more than 5%.
It is also interesting to see the difference 11 months can make, as investors were reeling in January when 10 of the 11 sectors were red (with only Energy gaining that month); March saw 10 of the 11 positive; April and May saw a mixed bag; June was all negative; July was overwhelmingly positive; August was mostly negative, September was all negative; October was almost all positive; and November was all positive. That’s volatility.
Here are the sector returns for the month of November and October (two very short time-periods):
S&P 500 Sector Oct. 2022 Nov. 2022 Information Technology +5.66% +4.42% Energy +23.71% +1.25% Health Care +8.05% +4.58% Real Estate +2.92% +6.52% Consumer Staples +6.89% +5.54% Consumer Discretionary -1.64% +0.11% Industrials +12.37% +7.20% Financials +10.57% +6.06% Materials +8.58% +10.51% Communication Services -1.75% +5.05% Utilities +0.00% +5.51% Source: FMR
What Does It Mean for Investors?
At a very basic level, the differences in returns for the 11 S&P 500 sectors support two fundamental principles of financial planning – asset allocation and diversification.
At your next portfolio review, let’s revisit the differences between asset allocation and diversification. And we can discuss how to ensure that your portfolio is consistent with your risk profile and personal goals.

-
Market Insights – Nov. 30, 2022
Home-Price-Gains Continue to Decline Across the United States
On Tuesday, S&P Dow Jones Indices released the latest results for the S&P CoreLogic Case-Shiller Indices, the leading measure of U.S. home prices. Data released today for September 2022 show that home price gains declined across the United States.
“The S&P CoreLogic Case-Shiller U.S. National Home Price NSA Index, covering all nine U.S. census divisions, reported a 10.6% annual gain in September, down from 12.9% in the previous month. The 10-City Composite annual increase came in at 9.7%, down from 12.1% in the previous month. The 20-City Composite posted a 10.4% year-over-year gain, down from 13.1% in the previous month.
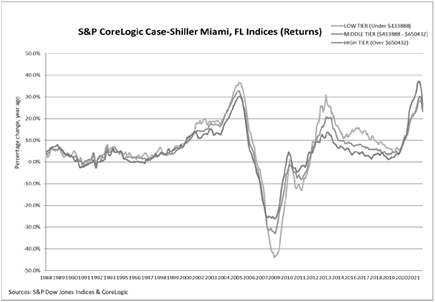
Miami, Tampa, and Charlotte reported the highest year-over-year gains among the 20 cities in September. Miami led the way with a 24.6% year-over-year price increase, followed by Tampa in second with a 23.8% increase, and Charlotte in third with a 17.8% increase. All 20 cities reported lower price increases in the year ending September 2022 versus the year ending August 2022.”
Month-Over-Month
“Before seasonal adjustment, the U.S. National Index posted a -1.0% month-over-month decrease in September, while the 10-City and 20-City Composites posted decreases of -1.4% and -1.5%, respectively.
After seasonal adjustment, the U.S. National Index posted a month-over-month decrease of -0.8%, and the 10-City and 20-City Composites both posted decreases of -1.2%.
In September, all 20 cities reported declines before and after seasonal adjustments.”
Analysis
“As has been the case for the past several months, our September 2022 report reflects short-term declines and medium-term deceleration in housing prices across the U.S. For example, the National Composite Index fell -1.0% in September, and now stands 10.6% above its year-ago level. We see comparable patterns in our 10- and 20-City Composites, which declined -1.4% and -1.5%, respectively, bringing their year-over-year gains down to 9.7% and 10.4%. For all three composites, year-over-year gains, while still well above their historical medians, peaked roughly six months ago and have decelerated since then.
Despite considerable regional differences, all 20 cities in our September report reflect these trends of short-term decline and medium-term deceleration. Prices declined in every city in September, with a median change of -1.2%. Year-over-year price gains in all 20 cities were lower in September than they had been in August.
The three best-performing cities in August repeated their performance in September. On a year-over- year basis, Miami (+24.6%) edged Tampa (+23.8%) for the top spot with Charlotte (+17.8%) beating Atlanta (+17.1%) for third place. The Southeast (+20.8%) and South (+19.9%) were the strongest regions by far, with gains more than double those of the Northeast, Midwest, and West; the two worst- performing cities were San Francisco (+2.3%) and Seattle (+6.2%).”
More Data Later This Week
More economic data will be released later this week, including GDP and MBA Mortgage Applications on Wednesday; Construction Spending and Jobless Claims on Thursday and Motor Vehicle Sales on Friday.
Sources: spglobal.com -
Tackling Trade & Treasuries

Major domestic indexes went down last week after all three gained more than 2% the previous week.[1] The S&P 500 dropped 0.54%, the Dow gave back 0.47%, and the NASDAQ lost 0.66%.[2] International stocks also stumbled; the MSCI EAFE decreased by 0.61%.[3]
-
Markets Post Week of Growth

On Friday, the markets closed the week gaining traction. The Dow had 7 days of consecutive growth, rising 2.34%—its largest weekly gain since March.[1] Meanwhile, the S&P 500 rose 2.41%, the NASDAQ jumped 2.68%, and the MSCI EAFE increased 1.41%.[2]