
Plus Interesting Highlights from 2021 Retail Sales
The U.S. Census Bureau conducts the Advance Monthly Retail Trade and Food Services Survey to provide an early estimate of monthly sales by kind of business for retail and food service firms located in the United States.
Each month, questionnaires are mailed to a probability sample of approximately 4,800 employer firms selected from the larger Monthly Retail Trade Survey.
Retail Sales Up in April 2023
On Tuesday, the U.S. Census Bureau announced the following advance estimates of U.S. retail and food services sales for April 2023 adjusted for seasonal variation and holiday and trading-day differences, but not for price changes, were $686.1 billion, up 0.4% from the previous month, and up 1.6% above April 2022.
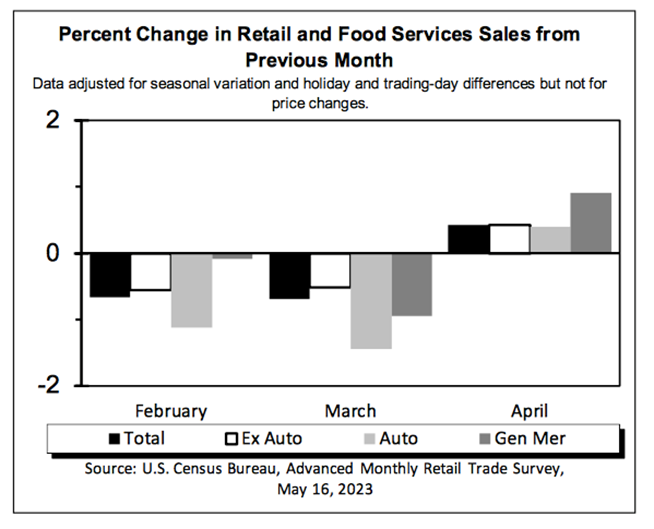
Further:
- Total sales for the February 2023 through April 2023 period were up 3.1% from the same period a year ago.
- The February 2023 to March 2023 percent change was revised from down 0.6% to down 0.7%.
- Retail trade sales were up 0.4% from March 2023, and up 0.5% above last year.
- Nonstore retailers were up 8.0% from last year
- Food services and drinking places were up 9.4% from April 2022.
Highlights From Total U.S. Retail Sales in 2021
- Retail sales for the nation increased 17.1%, from $5,572.0 billion in 2020 to $6,522.6 billion in 2021.
- Men’s clothing stores had $8.3 billion in sales in 2021, up 59.1% from 2020.
- Motor Vehicle and Parts Dealers’ sales increased 22.8%, from $1,208.2 billion in 2020 to $1,484.1 billion in 2021.
- Grocery Store sales increased 4.3%, from $759.4 billion in 2020 to $792.3 billion in 2021.
- Gasoline Station sales increased 32.6%, from $426.9 billion in 2020 to $566.1 billion in 2021.
- Electronic shopping and mail-order houses sales increased 15.4%, from $891.1 billion in 2020 to $1,028.0 billion in 2021.
Sources: census.gov