-
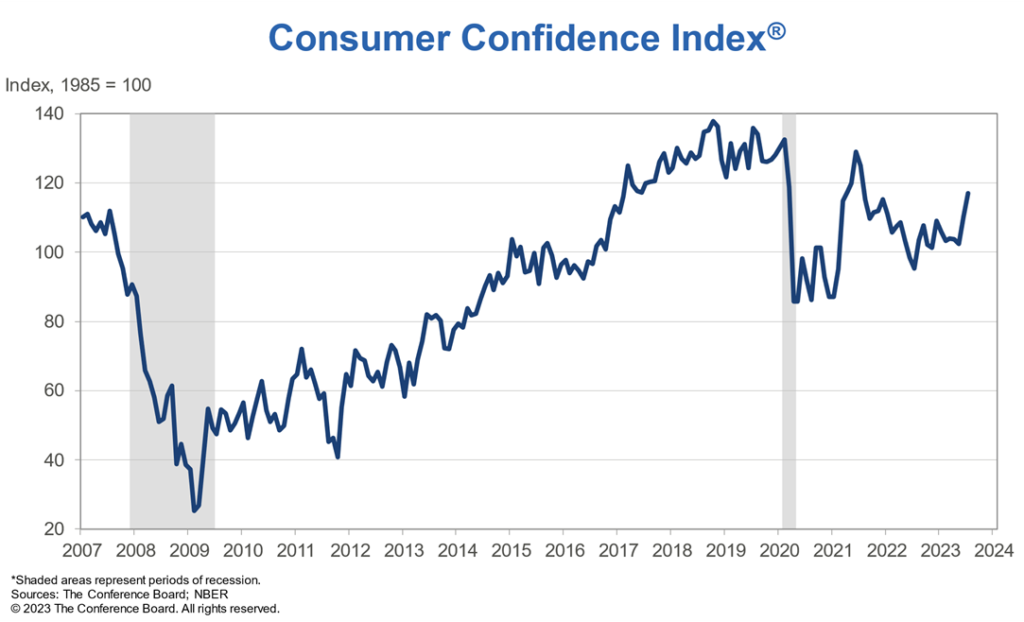
Consumer Confidence Up 2nd Month in A Row To Best Level Since July 2021

The Consumer Confidence Survey from the Conference Board “reflects prevailing business conditions and likely developments for the months ahead.”
This monthly Consumer Confidence report details consumer attitudes, buying intentions, vacation plans, and consumer expectations for inflation, stock prices, and interest rates. Data are available by age, income, 9 regions, and top 8 states.
On Tuesday, it was announced that the Conference Board Consumer Confidence Index rose again in July to 117.0 (1985=100), up from 110.1 in June.
Further:
- “The Present Situation Index – based on consumers’ assessment of current business and labor market conditions – improved to 160.0 (1985=100) from 155.3 last month.
- The Expectations Index – based on consumers’ short-term outlook for income, business, and labor market conditions – improved to 88.3 (1985=100) from 80.0 in June.
- Importantly, Expectations climbed well above 80 – the level that historically signals a recession within the next year. Despite rising interest rates, consumers are more upbeat, likely reflecting lower inflation and a tight labor market. Although consumers are less convinced of a recession ahead, we still anticipate one likely before year end.
Consumer confidence rose in July 2023 to its highest level since July 2021, reflecting pops in both current conditions and expectations. Headline confidence appears to have broken out of the sideways trend that prevailed for much of the last year. Greater confidence was evident across all age groups, and among both consumers earning incomes less than $50,000 and those making more than $100,000.”
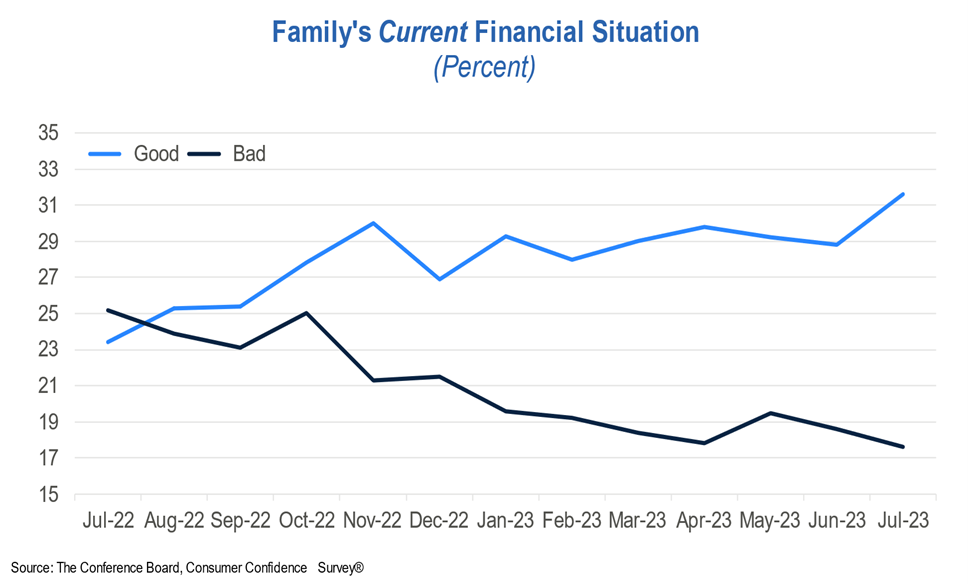
Family’s Current Financial Situation
Consumers’ assessment of their Family’s Current Financial Situation signals still-healthy family finances in July.
- 31.6% of consumers say their current family financial situation is “good,” up from 28.8% in June.
- 17.6% say their current family finances are “bad,” down from 18.6%.
Sources: conference-board.org
-
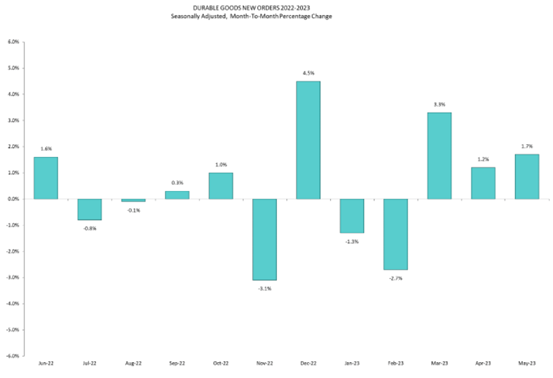
Manufactured Durable Goods Orders Up in May for 3rd Consecutive Month

On Tuesday, the U.S. Census Bureau announced the May advance report on durable goods manufacturers’ shipments, inventories and orders
New Orders
New orders for manufactured durable goods in May, up three consecutive months, increased $4.9 billion or 1.7% to $288.2 billion.
- This followed a 1.2% April increase.
- Excluding transportation, new orders increased 0.6%.
- Excluding defense, new orders increased 3.0%.
- Transportation equipment, also up three consecutive months, led the increase, $3.9 billion or 3.9% to $102.6 billion.
New Orders Over the Past 12 Months
Shipments
Shipments of manufactured durable goods in May, up two of the last three months, increased $4.8 billion or 1.7% to $282.7 billion. This followed a 0.6% April decrease. Transportation equipment, also up two of the last three months, led the increase, $4.0 billion or 4.6% to $91.8 billion.
Unfilled Orders
Unfilled orders for manufactured durable goods in May, up five of the last six months, increased $10.6 billion or 0.8% to $1,302.0 billion. This followed a 0.8% April increase. Transportation equipment, also up five of the last six months, drove the increase, $10.8 billion or 1.4% to $803.9 billion.
Inventories
Inventories of manufactured durable goods in May, up five of the last six months, increased $1.2 billion or 0.2% to $522.9 billion. This followed a 1.0% April increase. Machinery, up thirty-one consecutive months, led the increase, $0.5 billion or 0.5% to $94.4 billion.
Capital Goods
Nondefense new orders for capital goods in May increased $5.7 billion or 6.7% to $91.0 billion. Shipments increased $2.7 billion or 3.4% to $82.9 billion. Unfilled orders increased $8.1 billion or 1.1% to $748.7 billion. Inventories increased $0.1 billion or 0.1% to $225.5 billion. Defense new orders for capital goods in May decreased $2.7 billion or 14.7% to $15.9 billion. Shipments decreased $0.2 billion or 1.2% to $13.2 billion. Unfilled orders increased $2.7 billion or 1.3% to $213.6 billion. Inventories increased $0.1 billion or 0.2% to $24.2 billion.
Sources: nfib.com
For analysis, click the article below:
-
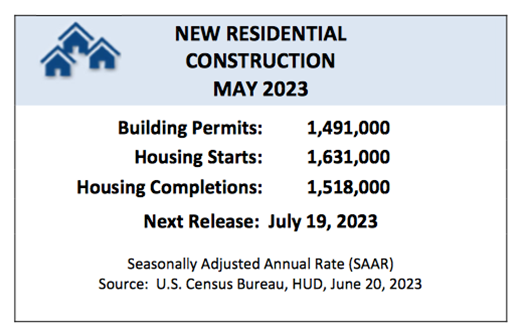
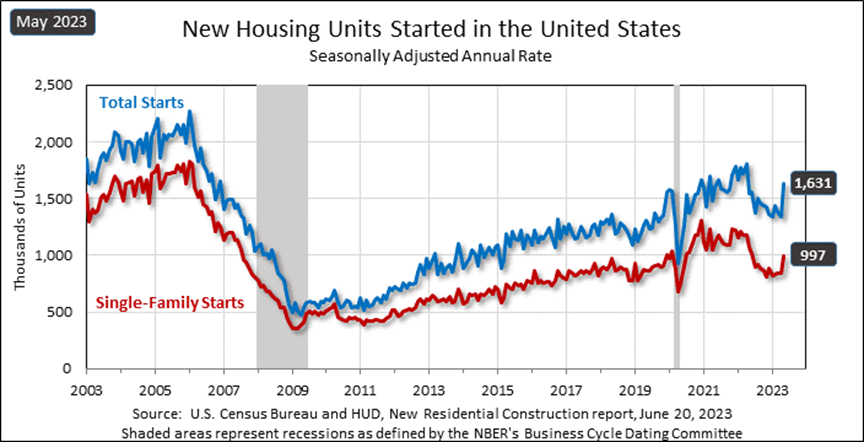
Building Permits, Housing Starts, and Housing Completions Up From April

On Tuesday, the U.S. Census Bureau and the U.S. Department of Housing and Urban Development jointly announced the following new residential construction statistics for May 2023:
Building Permits
- Privately‐owned housing units authorized by building permits in May were at a seasonally adjusted annual rate of 1,491,000.
- This is 5.2% above the revised April rate of 1,417,000.
- This is 12.7% below the May 2022 rate of 1,708,000.
- Single‐family authorizations in May were at a rate of 897,000.
- This is 4.8% above the revised April figure of 856,000.
- Authorizations of units in buildings with five units or more were at a rate of 542,000 in May.
Housing Starts
- Privately‐owned housing starts in May were at a seasonally adjusted annual rate of 1,631,000.
- This is 21.7% above the revised April estimate of 1,340,000.
- This is 5.7% above the May 2022 rate of 1,543,000.
- Single‐family housing starts in May were at a rate of 997,000
- This is 18.5% above the revised April figure of 841,000.
- The May rate for units in buildings with five units or more was 624,000.
Housing Completions
- Privately‐owned housing completions in May were at a seasonally adjusted annual rate of 1,518,000.
- This is 9.5% above the revised April estimate of 1,386,000.
- This is 5.0% above the May 2022 rate of 1,446,000.
- Single‐family housing completions in May were at a rate of 1,009,000; this is 3.9% above the revised April rate of 971,000.
- The May rate for units in buildings with five units or more was 493,000.
Sources: nfib.com
-
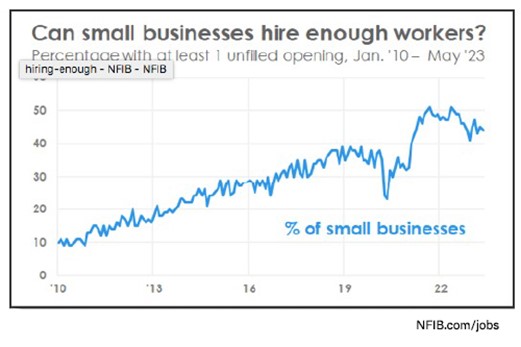
New Data from the NFIB Small Business Optimism Index

Small Businesses Feeling More Optimistic But This is the 17th Month in a Row Below the 49-Year Average
There are over 30 million small businesses in the United States, according to the Small Business Administration and small businesses comprise about 99% of all U.S. businesses. Further, about half of all Americans – 48% – are employed by small businesses, meaning almost 60 million employees in the U.S. work for a smaller company.
Small Businesses Feeling More Optimistic
On June 13th, “the NFIB Small Business Optimism Index increased 0.4 points in May to 89.4, which is the 17th consecutive month below the 49-year average of 98. The last time the Index was at or above the average was in December 2021. Small business owners expecting better business conditions over the next six months declined one point from April to a net negative 50%. Twenty-five percent of owners reported that inflation was their single most important problem in operating their business, up two points from last month and followed by labor quality at 24%.
Key findings include:
- Forty-four percent of owners reported job openings that were hard to fill, down one point from April and remaining historically very high.
- The net percent of owners raising average selling prices decreased one point to a net 32% (seasonally adjusted), still an inflationary level but trending down.
- The net percent of owners who expect real sales to be higher deteriorated two points from April to a net negative 21%.”
Job Openings Still Hard to Fill
Further, as reported in the NFIB’s monthly jobs report:
- Owners’ plans to fill open positions remain elevated, with a seasonally adjusted net 19% planning to create new jobs in the next three months.
- Overall, 63% of owners reported hiring or trying to hire in May, up three points from April.
- Of those hiring or trying to hire, 89% of owners reported few or no qualified applicants for their open positions.
In addition:
- A net 41% of owners reported raising compensation, up one point from April.
- A net 22% plan to raise compensation in the next three months, up one point.
- Ten percent of owners cited labor costs as their top business problem.
- 24% said that labor quality was their top business problem.
-
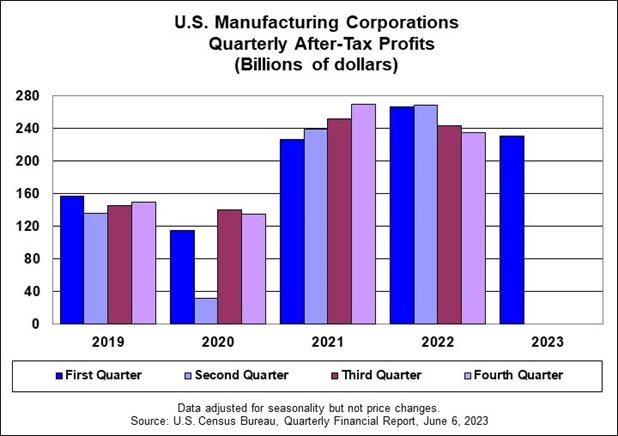
Retail Trade Corporations’ After-Tax Profits Up in Q1
Manufacturing Corporations’ Profits are Down in Q1
The U.S. Census Bureau today announced the following seasonally adjusted quarterly after-tax profits for retail trade industries statistics for First Quarter 2023:
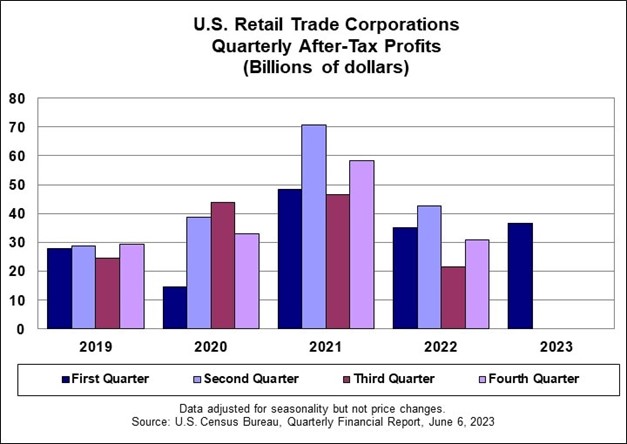
After-Tax Profits and Sales, 1Q 2023 – Seasonally Adjusted, Retail Trade Corporations
- Seasonally adjusted after-tax profits of U.S. retail corporations with assets of $50 million and over totaled $36.6 billion, up $5.6 billion from the $31.0 billion recorded in the fourth quarter of 2022.
- This is up $1.7 billion from the $35.0 billion recorded in the first quarter of 2022.
- Seasonally adjusted sales for the quarter totaled $1,001.6 billion, not statistically different from the $1,002.3 billion in the fourth quarter of 2022 and not statistically different from the $994.2 billion in the first quarter of 2022.
Manufacturing Industries
The U.S. Census Bureau also announced today the following seasonally adjusted quarterly after-tax profits for manufacturing industries statistics for First Quarter 2023:
After-Tax Profits and Sales, 1Q 2023 – Seasonally Adjusted, Manufacturing Corporations
- U.S. manufacturing corporations’ seasonally adjusted after-tax profits in the first quarter of 2023 totaled $230.5 billion, down $4.1 billion from the after-tax profits of $234.6 billion recorded in the fourth quarter of 2022.
- This is down $35.8 billion from the after-tax profits of $266.3 billion recorded in the first quarter of 2022.
- Seasonally adjusted sales for the quarter totaled $2,050.4 billion, down $19.7 billion from the $2,070.1 billion recorded in the fourth quarter of 2022, but not statistically different from the $2,019.9 billion in the first quarter of 2022.
Sources: census.gov
