-
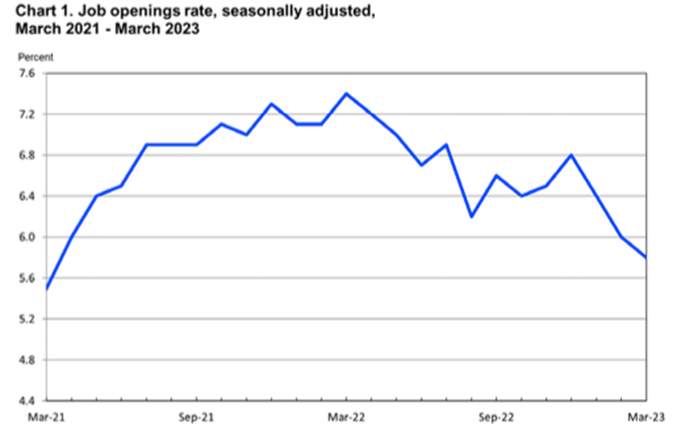
Number of Job Openings Drops for 3rd Month to Lowest Level in 2 Years
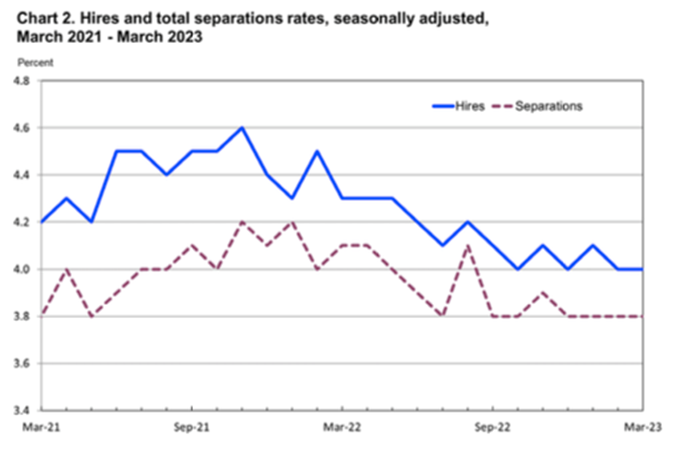
The number of job openings decreased to 9.6 million on the last business day of March, according to the U.S. Bureau of Labor Statistics. Over the month, the number of hires and total separations were little changed at 6.1 million and 5.9 million, respectively. Within separations, quits (3.9 million) changed little, while layoffs and discharges (1.8 million) increased. This release includes estimates of the number and rate of job openings, hires, and separations for the total nonfarm sector, by industry, and by establishment size class.
Job Openings
On the last business day of March, the number of job openings decreased to 9.6 million (-384,000) and was 1.6 million lower than in December. The job openings rate was 5.8% in March and was down by 1.0 percentage point since December. In March, job openings decreased in transportation, warehousing, and utilities (-144,000) but increased in educational services (+28,000).
Hires
In March, the number of hires was little changed at 6.1 million, and the rate held at 4.0%. Hires decreased in real estate and rental and leasing (-29,000).
Separations
The number of total separations changed little at 5.9 million in March, and the rate was 3.8% for the fourth month in a row. Over the month, the number of total separations decreased in accommodation and food services (-107,000) but increased in construction (+104,000).
In March, the number and rate of quits changed little at 3.9 million and 2.5%, respectively. The number of quits decreased in accommodation and food services (-178,000). In March, the number and rate of layoffs and discharges increased to 1.8 million (+248,000) and 1.2%, respectively. Layoffs and discharges increased in construction (+112,000), accommodation and food services (+63,000), and health care and social assistance (+42,000).
The number of other separations was little changed in March at 276,000. Other separations decreased in finance and insurance (-31,000) and in real estate and rental and leasing (-7,000).
Sources: bls.gov

-
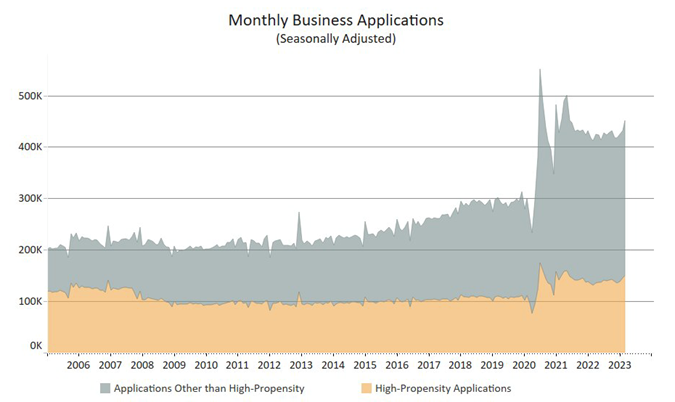
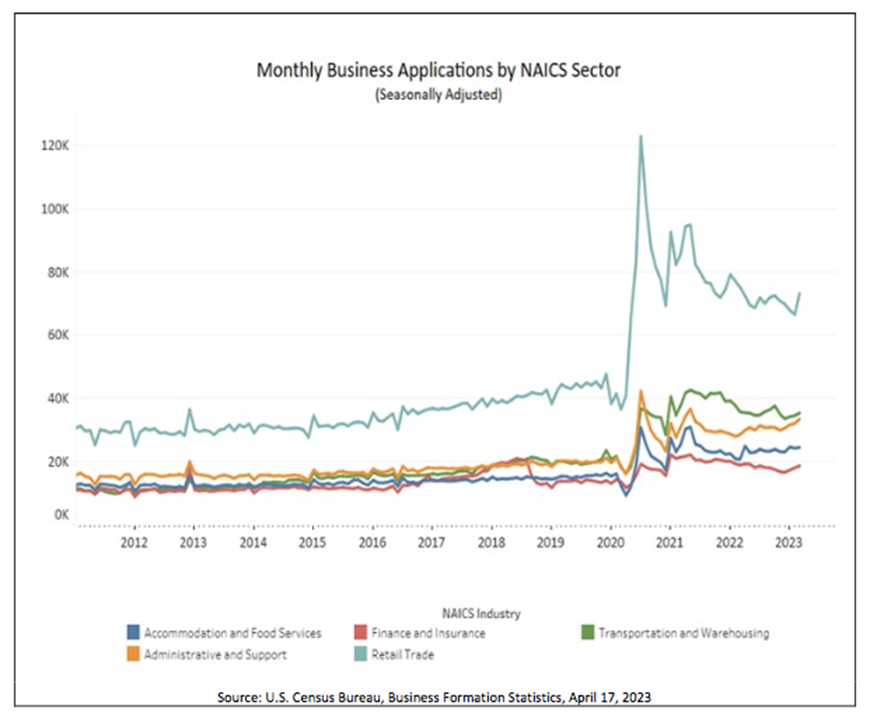
Business Applications Up 4.5% and Business Formations Up 5.4%

The U.S. Census Bureau announced the following seasonally adjusted business application and formation statistics for March 2023. The Business Application Series describe the business applications for tax IDs as indicated by applications for an Employer Identification Number through filings of the IRS Form SS-4. The Business Formation Series describe employer business formations as indicated by the first instance of payroll tax liabilities for the corresponding business applications.
Business Applications
Business Applications for March 2023 were 451,752, an increase of 4.5% compared to February 2023.
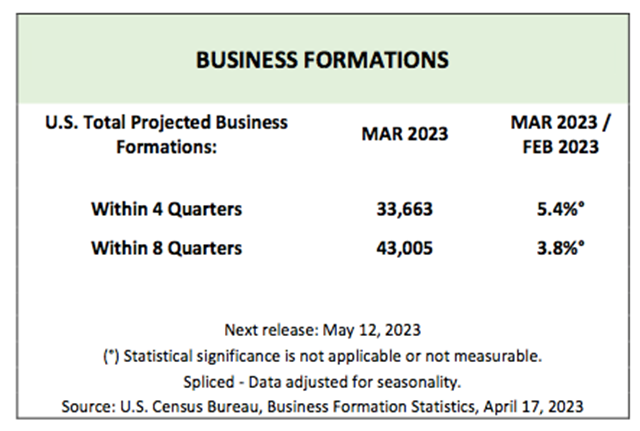
Business Formations
Projected Business Formations (within 4 quarters) for March 2023 were 33,663, an increase of 5.4% compared to February 2023. The projected business formations are forward looking, providing an estimate of the number of new business startups that will appear from the cohort of business applications in a given month. It does not provide an estimate of the total number of business startups that appeared within a specific month. In other words, the Census Bureau is projecting that 33,663 new business startups with payroll tax liabilities will form within 4 quarters of application from all the business applications filed during March 2023. The 5.4% increase indicates that for March 2023 there will be 5.4% more businesses projected to form within 4 quarters of application, compared to the analogous projections for February 2023.
More Data Later This Week
More economic data will be released later this week, including MBA Mortgage Applications on Wednesday and Jobless Claims and Existing Home Sales on Thursday.
Sources: census.gov

-
Wholesale Sales Jump in February While Inventories Rise Modestly

Wholesale trade measures the dollar value of sales made and inventories held by merchant wholesalers. It is a component of business sales and inventories.
Wholesale sales and inventory data give investors a hint as to where the consumer economy might be headed as it can be a precursor to consumer trends. For example, by analyzing the ratio of inventories to sales, investors can see how fast production will grow in coming months. Likewise, if unintended inventory accumulation occurs (i.e. sales did not meet expectations), then production will likely slow while those inventories are worked down.
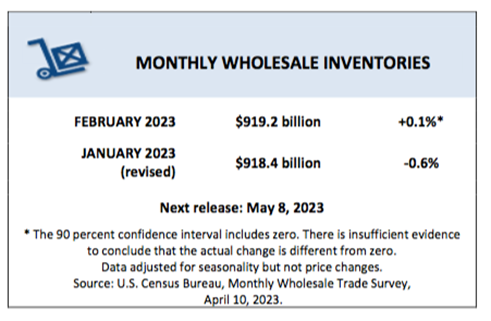
Wholesale Inventories in February On Monday, the U.S. Census Bureau reported the following new wholesale trade statistics for February 2023:
Sales
- February 2023 sales of merchant wholesalers, except manufacturers’ sales branches and offices, were $669.5 billion, up 0.4% from the revised January level.
- This is up 1.3% from the revised February 2022 level.
- The December 2022 to January 2023 percent change was revised from the Monthly Wholesale Annual Revision Report of up 0.9% to up 0.4%.
Inventories
- Total inventories of merchant wholesalers, except manufacturers’ sales branches and offices, were $919.2 billion at the end of February, up 0.1% from the revised January level.
- Total inventories were up 12.0% from the revised February 2022 level.
- The January 2023 to February 2023 percent change was revised from up 0.2% to up 0.1%.
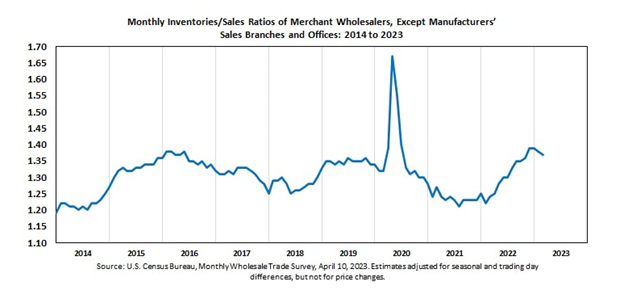
Inventories/Sales Ratio- The February inventories/sales ratio for merchant wholesalers, except manufacturers’ sales branches and offices, was 1.37.
- The February 2022 ratio was 1.24.
More Data Later This Week
More economic data will be released later this week, including CPI and MBA Mortgage Applications on Wednesday; Jobless Claims and PPI-Final Demand on Thursday; and Retail Sales, Business Inventories, Industrial Production and Consumer Sentiment on Friday.
Sources: census.gov
-
Construction Spending Down in February But Up Year-Over-Year

On Monday, the U.S. Census Bureau reported that construction spending during February 2023 was at an annual rate of $1,844.1 billion, 0.1% below the revised January estimate of $1,845.4 billion.
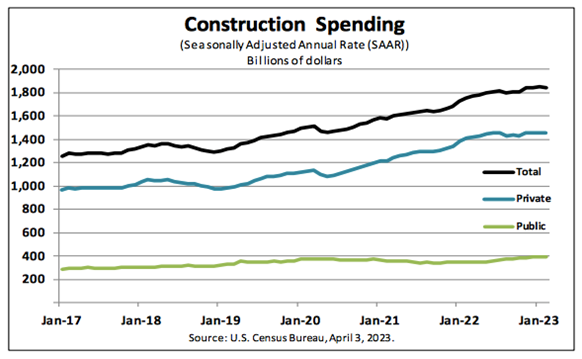
- The February figure is 5.2% above the February 2022 estimate of $1,753.1 billion.
- During the first two months of this year, construction spending amounted to $260.8 billion, 5.9% above the $246.1 billion for the same period in 2022.
Private Construction
- Spending on private construction was at a seasonally adjusted annual rate of $1,453.2 billion, virtually unchanged from the revised January estimate of $1,453.6 billion.
- Residential construction was at a seasonally adjusted annual rate of $852.1 billion in February, 0.6% below the revised January estimate of $857.0 billion.
- Nonresidential construction was at a seasonally adjusted annual rate of $601.0 billion in February, 0.7% above the revised January estimate of $596.7 billion.
Public Construction
- In February, the estimated seasonally adjusted annual rate of public construction spending was $391.0 billion, 0.2% below the revised January estimate of $391.8 billion.
- Educational construction was at a seasonally adjusted annual rate of $84.6 billion, 0.9% below the revised January estimate of $85.4 billion.
- Highway construction was at a seasonally adjusted annual rate of $120.6 billion, 0.3% above the revised January estimate of $120.3 billion.
Construction Spending Over 20 Years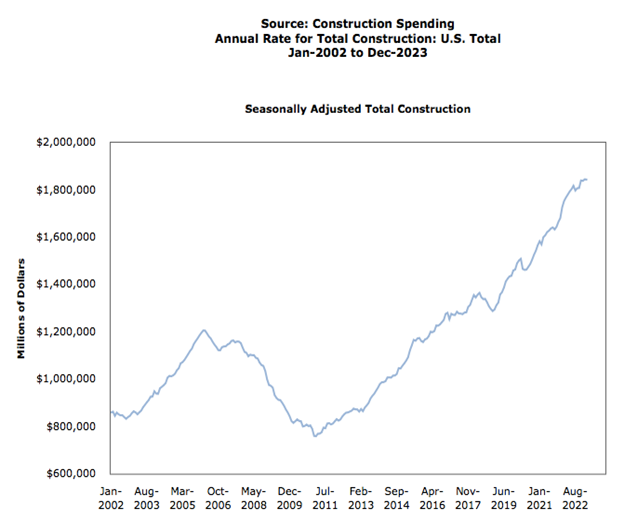
More Data Later This Week
More economic data will be released later this week, including the ADP Employment Report, MBA Mortgage Applications and ISM Services Index on Wednesday; Jobless Claims on Thursday; and Consumer Credit on Friday.
Sources: census.gov
-
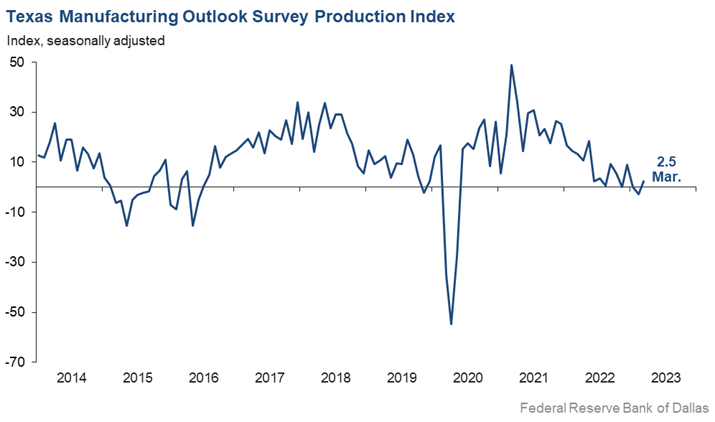
Modest Growth in Texas Manufacturing But Outlook Worsens

The Federal Reserve Bank of Dallas conducts the Texas Manufacturing Outlook Survey monthly to obtain a timely assessment of the state’s factory activity. Firms are asked whether output, employment, orders, prices and other indicators increased, decreased or remained unchanged over the previous month. Responses are aggregated into balance indexes where positive values generally indicate growth while negative values generally indicate contraction.
On Monday, the Dallas Fed ran this headline:
Modest growth resumes in Texas manufacturing, but outlooks continue to worsen
From the release: “Texas factory activity expanded slightly in March after contracting in February. The production index, a key measure of state manufacturing conditions, moved up from -2.8 to 2.5, a reading suggestive of a modest increase in output.
Further, other measures of manufacturing activity showed mixed signals this month, including:
- The new orders index was negative for a 10th month in a row and came in at -14.3, little changed from February.
- The growth rate of orders index was also negative and largely unchanged, at -15.2.
- The capacity utilization index returned to positive territory, moving up six points to 2.3.
- The shipments index pushed down from -5.0 to -10.5.
Perceptions of broader business conditions continued to worsen in March. The general business activity index slipped two points to -15.7. The company outlook index remained negative but rose four points to -13.3. The outlook uncertainty index came in at 22.0, down slightly from February but still elevated.
Labor market measures suggest a resumption of employment growth and continued lengthening of workweeks. The employment index shot up 11 points to 10.4 after dipping below zero last month. Twenty-four percent of firms noted net hiring, while 14 percent noted net layoffs. The hours worked index edged down to 2.6, a reading slightly below average.
Price and wage pressures receded in March, though wage growth remained elevated relative to average. The raw materials prices index retreated five points to 20.3, falling further below its series average of 27.9. The finished goods prices index dropped from 15.8 to 7.0, falling below its series average of 9.0 for the first time since 2020. The wages and benefits index inched down two points to 30.5.
Expectations regarding future manufacturing activity were mixed in March. The future production index remained positive but fell eight points to 13.5, signaling well-below-average output growth is expected over the next six months. The future general business activity index pushed further negative, from -2.9 to -11.2. Most other measures of future manufacturing activity remained positive but moved lower this month.
Sources: dallasfed.org