-
The One-Day Trade Settlement: What It Means for Investors

Introduction
On May 28th, 2024, a seemingly inconspicuous trade settlement change swept through the financial markets in the United States. While it might have gone unnoticed by many, this update holds significant implications for investors, both individual and institutional. Let’s delve into the details of what transpired and explore its impact on the world of investing.
The Trade Settlement Period: A Crucial Aspect
Before we dive into the recent change, let’s understand the concept of trade settlement. When you buy or sell a security (such as stocks, bonds, or exchange-traded funds), the actual transfer of ownership and funds doesn’t happen instantaneously. Instead, there’s a lag between the trade execution and the settlement—the moment when ownership officially changes hands and funds are exchanged.
Traditionally, the settlement period for U.S. and Canadian securities traded on U.S. exchanges was two business days after the trade date. In other words, if you sold a stock on Monday, the settlement would occur on Wednesday. This delay allowed time for various administrative processes, including verifying the trade details, transferring shares, and ensuring the funds were available.
The Latest Update
As of May 28th, 2024, the trade settlement period for U.S. and Canadian securities traded on U.S. exchanges was shortened to one day after the trade date.
The Impact on Individuals
- Faster Processing Time – For individual investors, this change translates into speed. When you sell a security, you’ll receive the proceeds in half the time. No more waiting for two days; your cash will be available sooner. Whether you’re reallocating your portfolio, taking profits, or rebalancing, the reduced settlement period enhances your agility.
- Reduced Transaction Risk – Imagine you’re selling a stock to fund an important life event—a down payment on a house, your child’s education, or retirement expenses. With the shorter settlement window, there’s less exposure to market fluctuations. The risk of unexpected price movements impacting your transaction diminishes significantly.
The Institutional Perspective
Institutions—brokerages, mutual funds, and pension funds—also benefit. The streamlined settlement process reduces operational complexities. It simplifies back-office tasks, minimizes reconciliation efforts, and enhances overall efficiency. For large-scale trading operations, this adjustment is a game-changer.
Conclusion
The seemingly subtle shift from a two-day settlement to a one-day settlement is anything but trivial. It aligns with the digital age’s need for speed, efficiency, and risk reduction. As investors, we welcome this change—one that empowers us to act swiftly and confidently. So, the next time you execute a trade, remember that behind the scenes, the wheels are turning faster than ever.
For a more detailed analysis of the institutional impact, you can explore the SEC’s fact sheet. Additionally, if you have any questions or need personalized guidance, our team at Lane Hipple is here to assist you.
-
The Market and Election Cycles
History underscores that shareholders are investing in companies, not a political party
It’s natural for investors to seek a connection between who wins the White House and which was stocks will go. Regardless of who wins, nearly a century of returns shows that stocks have trended upward.
It is also unlikely that making investment decisions based on control of the chambers of Congress will lead to better financial outcomes.
Stocks tend to reward disciplined investors no matter who is President or who controls Congress. This election season, fight the urge to take actions driven by emotions such as fear or greed. Hiring a financial planner can help you stay on track and provide you with well-reasoned advice if and when you become emotional.
Source: https://my.dimensional.com/
-
EQUITIES ADVANCE LAST WEEK AS THE FED RAISES RATES BY 25 BASIS POINTS
CORPORATE EARNINGS COME IN BETTER THAN EXPECTED
Summary
- The small-cap Russell 2000 (+1.1%) recorded another positive week, followed closely by the S&P 500 (+1.0%) and the DJIA (+0.7%)
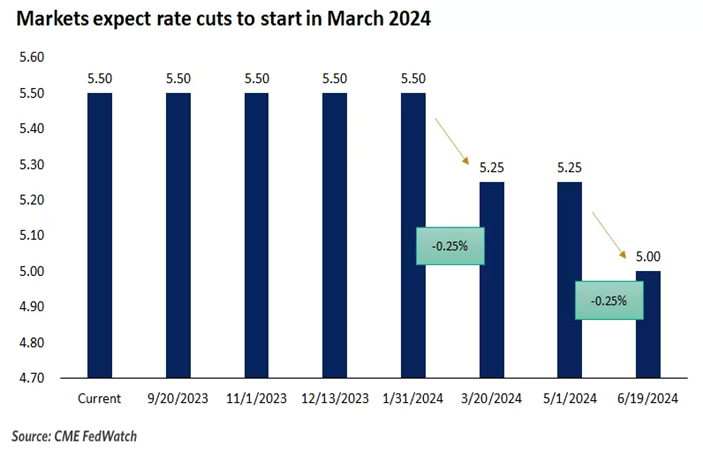
- There was a lot of economic news last week, but by far the biggest news was probably also the most expected, when the Fed voted on Wednesday to raise the target range for the fed funds rate by 25 basis points to 5.25-5.50%
- Surprisingly, Wall Street reacted well to the expected rate hike, on hopes that the Fed is done raising rates for the year, as the CME FedWatch Tool put the probability of a second rate hike any time later this year at less than 30%
- It was a busy earnings week, too, with Microsoft, Google (Alphabet) and Facebook (Meta) all moving decently
- Of the 11 S&P 500 sectors, 9 were positive as the Communication Services led the pack with a whopping 6.9% gain, whereas Utilities and Real Estate dropped by about 2% each
- The 10-year Treasury yield moved up 11 basis points and came to rest at 3.96%, a whisper away from that 4% threshold so important to Wall Street
Weekly Market Update – as of JULY 28, 2023
Close Week YTD DJIA 35,459 +0.7% +7.0% S&P 500 4,582 +1.0% +18.3% NASDAQ 14,317 +2.0% +36.8% Russell 2000 1,982 +1.1% +12.5% MSCI EAFE 2,196 +1.0% +13.0% Bond Index* 2,087.52 -0.35% +1.80% 10-Year Treasury 3.96% +0.11% +0.1% *Source: Bonds represented by the Bloomberg Barclays US Aggregate Bond TR USD.
This chart is for illustrative purposes only and does not represent the performance of any specific security. Past performance cannot guarantee future results
Stocks Advance as Fed Raises Rates
Stocks had a good week, as all four of the major U.S. equity indexes advanced on hopes that a soft landing engineered by the Federal Reserve was becoming real. Most encouraging for investors was the fact that the DJIA saw its 13th consecutive daily gain through Wednesday, marking its longest winning streak since 1987. Growth stocks far outpaced Value stocks, driven by NASDAQ’s 2% gain, which padded its 36%+ YTD gain.
The week’s biggest news was widely anticipated, as the Federal Reserve voted unanimously on Wednesday to raise the fed funds rate by 25 basis points, after pausing last month. Fed Chair Jerome Powell was non-committal about whether rates would be raised further, but he did acknowledge that inflation is far from its most-recent peak. The fed futures market is predicting that there will be about a 30% chance of another rate hike later this year.
There was a lot of economic data received last week and here are a few highlights:
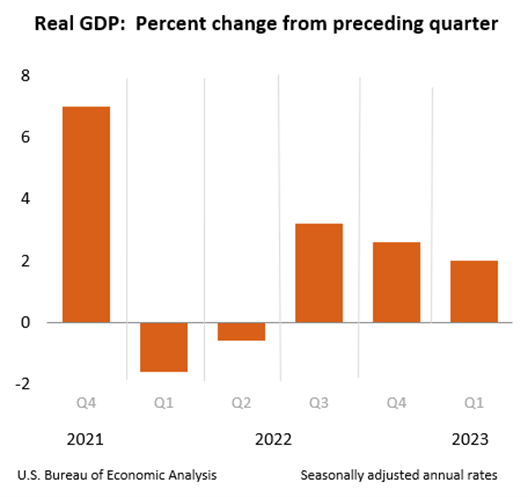
- Q1 GDP revised up significantly;
- New home sales jumped in May;
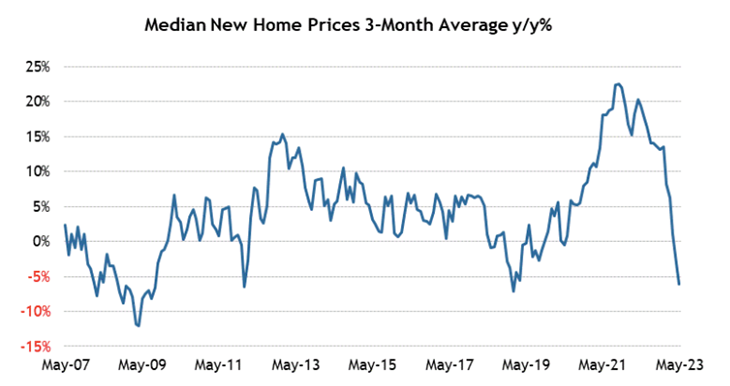
- New home sales prices declined in May;
- Durable goods orders advanced in May;
- Consumer confidence leapt in July;
- Personal income increased in May;
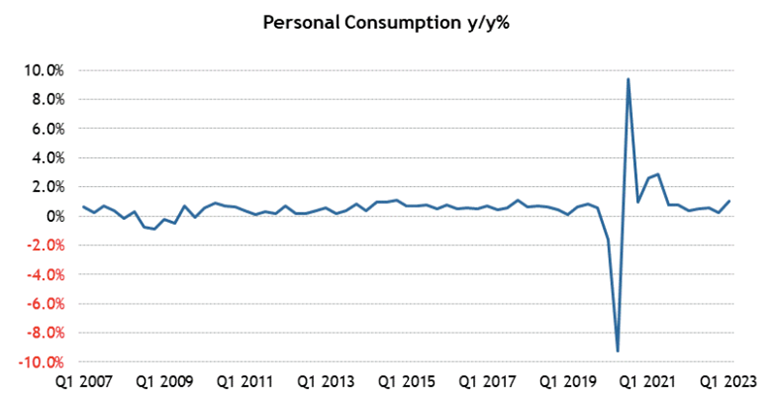
- Personal spending rose in May;
- Wages and salaries increased in May;
- Initial jobless claims dropped last week
GDP Revised Up Significantly
The third estimate for Q1 GDP saw a very large, upward revision to 2.0% from 1.3%, as consumer spending proved to be much more robust than anticipated.
Highlights
- Personal consumption expenditures growth was revised to 4.2% from 3.8%. That contributed 2.79 percentage points to Q1 GDP growth versus the second estimate of 2.52 percentage points.
- Gross private domestic investment declined 11.9%, versus the second estimate of -11.5%, after increasing 4.5% in Q4. This subtracted 2.22 percentage points from GDP growth versus 2.14 percentage points in the second estimate.
- Exports were up 7.8%, versus the second estimate of 5.2%, after declining 3.7% in Q4. Imports were up 2.0%, versus 4.0% in the second estimate, after declining 5.5% in Q4. Net exports contributed 0.58 percentage points to Q1 GDP growth versus the second estimate of 0.00 percentage points.
- Government spending increased 5.0%, versus the second estimate of 5.2%, after increasing 3.8% in Q4. This added 0.85 percentage points to Q1 GDP growth versus 0.89 percentage points in the second estimate.
New Home Sales Jump in May But Sales Prices Decline
New home sales surged 12.2% month-over-month in May to a seasonally adjusted annual rate of 763,000 units. On a year-over-year basis, new home sales were up 20.0%, but the median sales price declined 7.6% year-over-year to $416,300 while the average sales price declined 6.6% to $487,300.
In addition:
- New home sales month-over-month/year-over-year by region:
- Northeast (+17.6%/+110.5%);
- Midwest (+4.1%/+40.0%);
- South (+11.3%/+22.0%);
- West (+17.4%/-0.6%).
- At the current sales pace, the supply of new homes for sale stood at 6.7 months, versus 7.6 months in April and 8.3 months in May 2022.
- The percentage of new homes sold for $399,999 or less accounted for 44% of new homes sold versus 49% in April and 39% one year ago.
Durable Goods Orders Are UP
Total durable goods orders were up 1.7% month-over-month following an upwardly revised 1.2% increase (from 1.1%) in April. Excluding transportation, durable goods orders increased 0.6% month-over-month following a downwardly revised 0.6% decline (from -0.2%) in April.
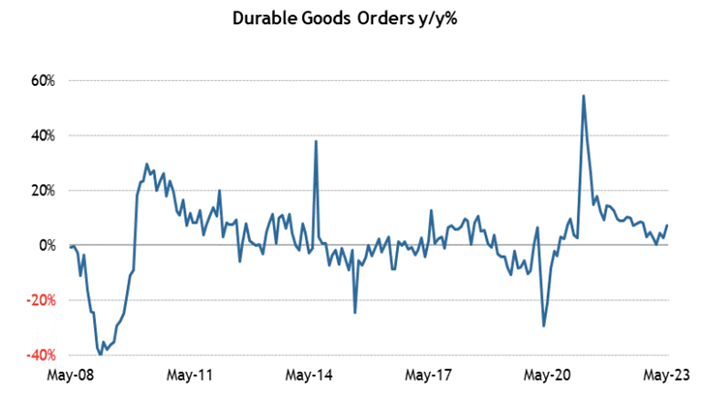
Highlights
- New orders for machinery jumped 1.0% after increasing 0.3% in April.
- New orders for computers and electronic products increased 0.3% after declining 1.8% in April.
- New orders for fabricated metal products were flat after declining 0.2% in April.
- Transportation equipment orders jumped 3.9% after increasing 4.8% in April. New orders for motor vehicles and parts were up 2.2% after being flat in April. New orders for nondefense aircraft and parts rose 32.5% after slipping 2.0% in April.
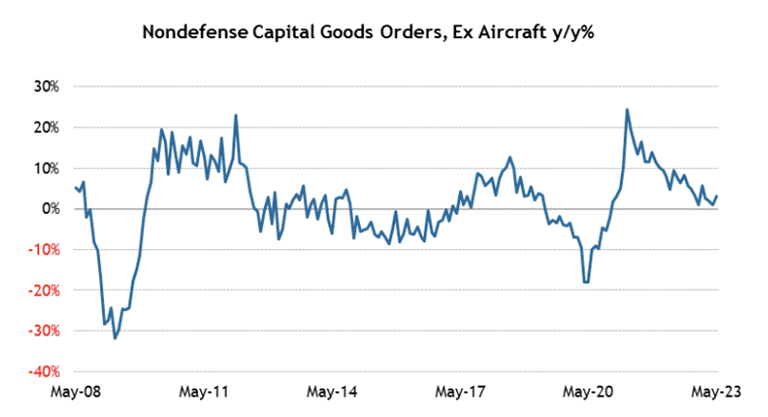
- Shipments of nondefense capital goods excluding aircraft, which factors into GDP computations, increased 0.2% following a 0.4% increase in April.
Sources: conference-board.org; bea.gov; census.gov; msci.com; fidelity.com; nasdaq.com; wsj.com; morningstar.com

- The small-cap Russell 2000 (+1.1%) recorded another positive week, followed closely by the S&P 500 (+1.0%) and the DJIA (+0.7%)
-
Understanding the Fed’s Pause on Rate Hikes
Remain vigilant as we might see more rate hikes later this summer
The decision by the Federal Reserve to pause its upward trajectory of the federal funds rate – after 10 straight hikes over the past 14 months – has significant implications for investors. As the central bank of the United States, the Fed’s monetary policy decisions have a profound impact on financial markets and the investment landscape.
Let’s explore what this pause means for investors and explore potential strategies to navigate this new environment.
Understanding the Pause
To grasp the implications of the Fed’s pause, it is crucial to understand the underlying reasons for this shift in policy. The Federal Reserve’s primary mandate is to maintain price stability and support maximum employment. The decision to halt rate hikes suggests that the Fed believes inflationary pressures may be lessening or that the economy requires more time to fully recover. By pausing rate hikes, the central bank aims to provide ongoing support to economic growth.
Bond and Fixed-Income Investments
The Fed’s pause on rate hikes has immediate implications for bond and fixed-income investors. Typically, rising interest rates lead to declining bond prices. However, with the Fed indicating a pause in rate hikes, bond prices may stabilize or even experience modest gains. This is particularly relevant for long-term bondholders who were concerned about potential losses in a rising rate environment.
Nevertheless, investors should remain vigilant. While the pause in rate hikes may provide some relief, it is essential to monitor inflationary trends and the Federal Reserve’s future actions. Unexpected shifts in inflation expectations or the resumption of rate hikes could still impact fixed-income investments.
Equity Markets and Investment Strategies
The Fed’s pause on rate hikes can also have a significant impact on equity markets. Historically, low interest rates have been supportive of stock prices, as they reduce borrowing costs for businesses and increase the present value of future earnings. Investors should consider the potential for continued strength in equity markets as long as the pause in rate hikes persists.
However, it is crucial to exercise caution and avoid complacency. Market conditions can change rapidly, and investors should remain attentive to both global economic developments and the possibility of future rate hikes. Adopting a diversified investment strategy that balances exposure across sectors and geographies can help mitigate risks associated with potential market volatility.
Related Report: Charles Schwab’s Mid-Year Outlook
Sector Rotation and Asset Allocation
The pause in rate hikes offers an opportunity for investors to reassess their sector allocations and asset mix.
Certain sectors, such as utilities and real estate, tend to perform well in a low-interest-rate environment.
These sectors often exhibit stable cash flows and attractive dividend yields, making them appealing to income-focused investors.
Conversely, sectors like financials and banking may face challenges due to narrower interest rate spreads. Investors may consider rotating their investments into sectors that could benefit from the pause in rate hikes, while also maintaining a long-term perspective and keeping diversification in mind.
International Considerations
The Fed’s decision to pause rate hikes also has implications beyond the United States. Lower interest rates in the U.S. can lead to a weaker U.S. dollar, potentially benefiting international investments and exporters. Investors should consider the potential impact on currency valuations and diversify their portfolios by allocating a portion of their investments to international markets.
What Investors Should Do
The Federal Reserve’s pause on rate hikes represents a significant development for investors. The decision suggests that the central bank is carefully monitoring economic conditions and adjusting its policies accordingly. Bond and fixed-income investors may find some respite, while equity investors should remain attentive to potential shifts in market dynamics.
To navigate this evolving landscape, investors should adopt a diversified approach, reassess sector allocations, and consider the potential benefits of international investments.
Staying informed, monitoring economic indicators, and seeking professional advice can help investors make well-informed decisions in this environment of paused rate hikes. Even if it only lasts for a month.
-
U.S. Wholesale Inventories Fell in January for the First Time Since July 2020

Still Up 15.8% Since January 2022
On Tuesday, the U.S. Census Bureau announced the following new wholesale trade statistics for January 2023:
Sales
- January 2023 sales of merchant wholesalers, except manufacturers’ sales branches and offices, were $693.8 billion, up 1.0% from the December level and up 3.6% from the January 2022 level.
- The November 2022 to December 2022 % change was revised from the preliminary estimate of virtually unchanged to down 0.2%.
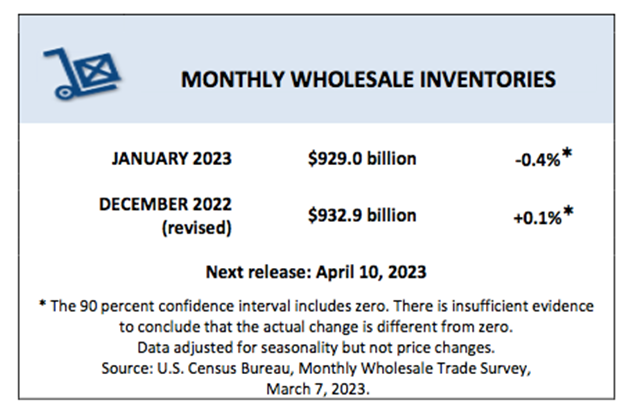
Inventories
- Total inventories of merchant wholesalers, except manufacturers’ sales branches and offices were $929.0 billion at the end of January, down 0.4% from the December level.
- Total inventories were up 15.8% from the January 2022 level.
- The December 2022 to January 2023 % change was unrevised from the advance estimate of down 0.4%.
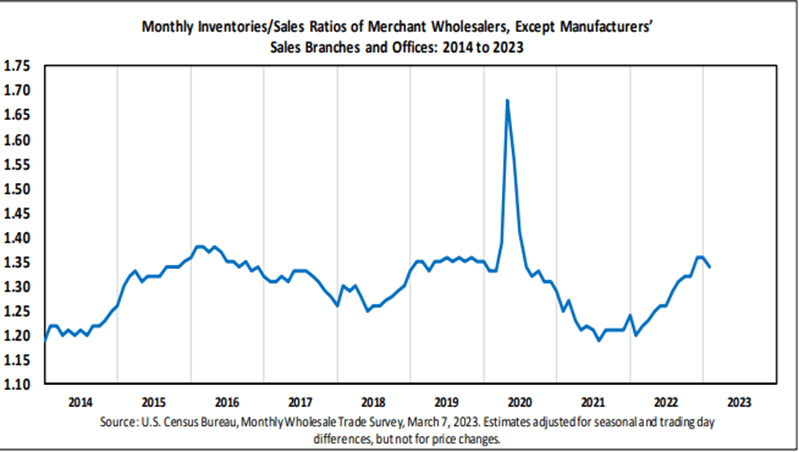
Inventories/Sales Ratio
- The January inventories/sales ratio for merchant wholesalers, except manufacturers’ sales branches and offices was 1.34.
- The January 2022 ratio was 1.20.
Wholesale Inventories – Last 20 Years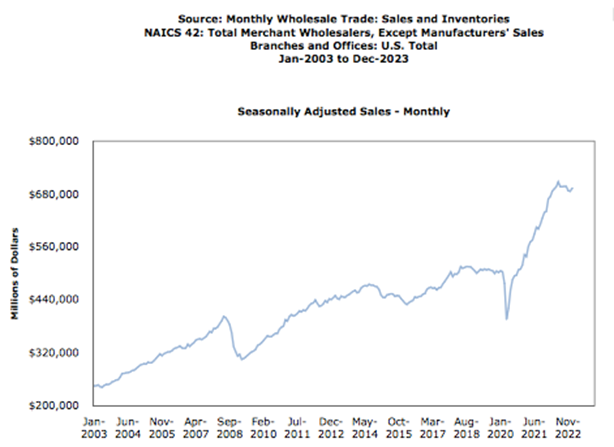
Sources: census.gov
