-
Retail Trade Corporations’ After-Tax Profits Up in Q1
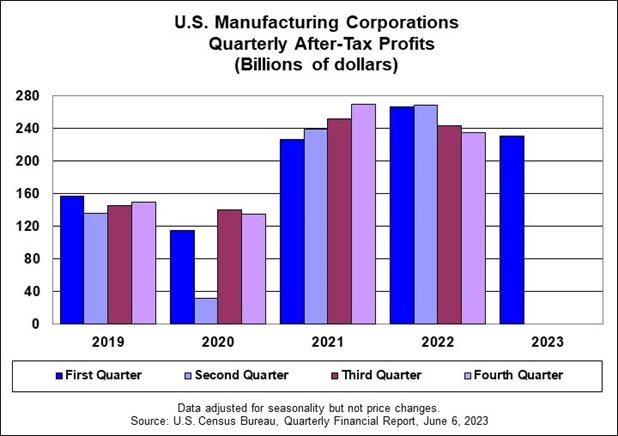
Manufacturing Corporations’ Profits are Down in Q1
The U.S. Census Bureau today announced the following seasonally adjusted quarterly after-tax profits for retail trade industries statistics for First Quarter 2023:
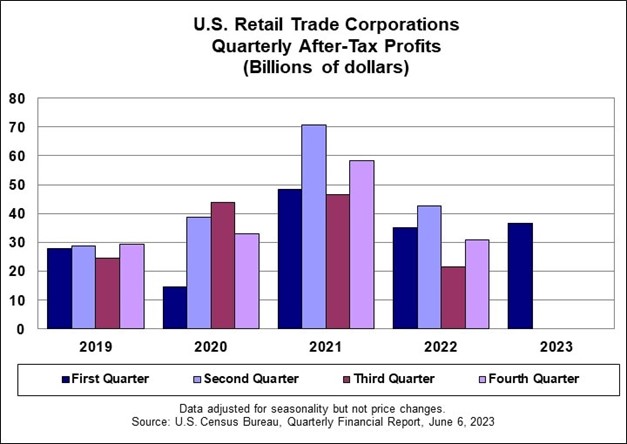
After-Tax Profits and Sales, 1Q 2023 – Seasonally Adjusted, Retail Trade Corporations
- Seasonally adjusted after-tax profits of U.S. retail corporations with assets of $50 million and over totaled $36.6 billion, up $5.6 billion from the $31.0 billion recorded in the fourth quarter of 2022.
- This is up $1.7 billion from the $35.0 billion recorded in the first quarter of 2022.
- Seasonally adjusted sales for the quarter totaled $1,001.6 billion, not statistically different from the $1,002.3 billion in the fourth quarter of 2022 and not statistically different from the $994.2 billion in the first quarter of 2022.
Manufacturing Industries
The U.S. Census Bureau also announced today the following seasonally adjusted quarterly after-tax profits for manufacturing industries statistics for First Quarter 2023:
After-Tax Profits and Sales, 1Q 2023 – Seasonally Adjusted, Manufacturing Corporations
- U.S. manufacturing corporations’ seasonally adjusted after-tax profits in the first quarter of 2023 totaled $230.5 billion, down $4.1 billion from the after-tax profits of $234.6 billion recorded in the fourth quarter of 2022.
- This is down $35.8 billion from the after-tax profits of $266.3 billion recorded in the first quarter of 2022.
- Seasonally adjusted sales for the quarter totaled $2,050.4 billion, down $19.7 billion from the $2,070.1 billion recorded in the fourth quarter of 2022, but not statistically different from the $2,019.9 billion in the first quarter of 2022.
Sources: census.gov

-
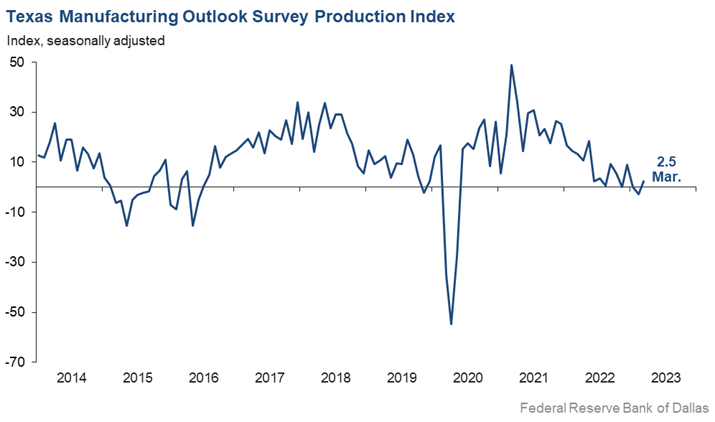
Modest Growth in Texas Manufacturing But Outlook Worsens

The Federal Reserve Bank of Dallas conducts the Texas Manufacturing Outlook Survey monthly to obtain a timely assessment of the state’s factory activity. Firms are asked whether output, employment, orders, prices and other indicators increased, decreased or remained unchanged over the previous month. Responses are aggregated into balance indexes where positive values generally indicate growth while negative values generally indicate contraction.
On Monday, the Dallas Fed ran this headline:
Modest growth resumes in Texas manufacturing, but outlooks continue to worsen
From the release: “Texas factory activity expanded slightly in March after contracting in February. The production index, a key measure of state manufacturing conditions, moved up from -2.8 to 2.5, a reading suggestive of a modest increase in output.
Further, other measures of manufacturing activity showed mixed signals this month, including:
- The new orders index was negative for a 10th month in a row and came in at -14.3, little changed from February.
- The growth rate of orders index was also negative and largely unchanged, at -15.2.
- The capacity utilization index returned to positive territory, moving up six points to 2.3.
- The shipments index pushed down from -5.0 to -10.5.
Perceptions of broader business conditions continued to worsen in March. The general business activity index slipped two points to -15.7. The company outlook index remained negative but rose four points to -13.3. The outlook uncertainty index came in at 22.0, down slightly from February but still elevated.
Labor market measures suggest a resumption of employment growth and continued lengthening of workweeks. The employment index shot up 11 points to 10.4 after dipping below zero last month. Twenty-four percent of firms noted net hiring, while 14 percent noted net layoffs. The hours worked index edged down to 2.6, a reading slightly below average.
Price and wage pressures receded in March, though wage growth remained elevated relative to average. The raw materials prices index retreated five points to 20.3, falling further below its series average of 27.9. The finished goods prices index dropped from 15.8 to 7.0, falling below its series average of 9.0 for the first time since 2020. The wages and benefits index inched down two points to 30.5.
Expectations regarding future manufacturing activity were mixed in March. The future production index remained positive but fell eight points to 13.5, signaling well-below-average output growth is expected over the next six months. The future general business activity index pushed further negative, from -2.9 to -11.2. Most other measures of future manufacturing activity remained positive but moved lower this month.
Sources: dallasfed.org

-
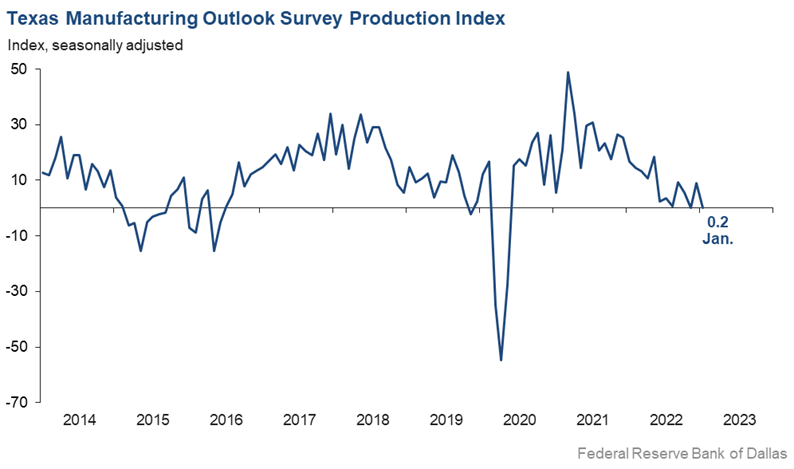
Manufacturers in Texas Saw Growth in Factory Activity Slow in January

Every month, the Federal Reserve Bank of Dallas asks Texas business executives questions on labor market conditions and the results are compiled into the Texas Manufacturing Outlook Survey, the Texas Service Sector Outlook Survey and the Texas Retail Outlook Survey.
On January 30th, the Federal Reserve Bank of Dallas reported that: “Growth in Texas factory activity slowed in January, according to business executives responding to the Texas Manufacturing Outlook Survey. The production index, a key measure of state manufacturing conditions, fell from 9.1 to 0.2, with the near-zero reading suggestive of flat output.
Other measures generally indicated weakened manufacturing activity this month. The new orders index was negative for an eighth month in a row – suggesting a continued decrease in demand – though it moved up from -11.0 to -4.0. The growth rate of orders index inched down to -12.3. The capacity utilization index was positive but dipped from 7.9 to 6.0, while the shipments index returned to negative territory at a reading of -6.3.
Perceptions of broader business conditions continued to worsen in January, though pessimism waned. The general business activity index remained negative but shot up 12 points to -8.4. Similarly, the company outlook index posted its 11th straight negative reading but moved up 11 points to -2.5. The outlook uncertainty index was largely unchanged at 16.8.
Labor Market & Price Pressures
Labor market measures pointed to stronger employment growth and longer workweeks.
- The employment index climbed four points to 17.6, a reading significantly above its series average of 7.9.
- Thirty-one percent of firms noted net hiring, while 13 percent noted net layoffs.
- The hours worked index held fairly steady at 3.8.
Further, price pressures were generally steady and wage growth eased slightly in January.
- The raw materials prices index was largely stable at 20.5, remaining below its series average of 28.0 for the third month in a row.
- The finished goods prices index was little changed at 9.9, roughly in line with its series average of 9.0.
- The wages and benefits index ticked down from 34.2 to 30.5.
Expectations regarding future manufacturing activity were mixed in January. The future production index pushed further positive to 16.1, signaling that respondents expect output growth over the next six months. The future general business activity index remained negative, coming in at -9.1. Most other measures of future manufacturing activity were positive this month.”
Sources: dallasfed.org
-
Conference Board Leading & Coincident Economic Indicators Pointing to a Recession

The Conference Board was founded in 1916 by a group of CEOs “concerned about the impact of workplace issues on business, and with a desire for greater cooperation and knowledge sharing among businesses.”
Every month, the Conference Board compiles a composite of economic indexes designed to signal peaks and troughs in the business cycle. The leading, coincident, and lagging economic indexes are essentially composite averages of 10 individual indicators and help smooth out some of the volatility of individual components.
The ten components include:
- Average weekly hours, manufacturing
- Average weekly initial claims for unemployment insurance
- Manufacturers’ new orders, consumer goods and materials
- ISM Index of New Orders
- Manufacturers’ new orders, nondefense capital goods excluding aircraft orders
- Building permits, new private housing units
- Stock prices, 500 common stocks
- Leading Credit Index
- Interest rate spread, 10-year Treasury bonds less federal funds
- Average consumer expectations for business conditions
Leading Indicators Signaling a Recession
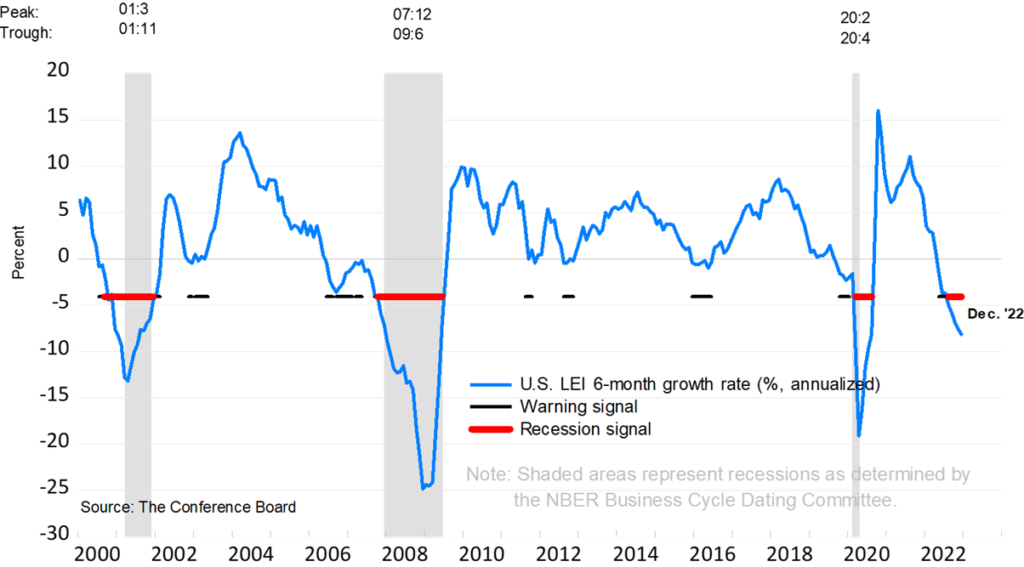
On January 23rd, the Conference Board announced that its Leading Economic Index for the U.S. decreased by 1.0% in December 2022 to 110.5 (2016=100), following a decline of 1.1% in November.
The LEI is now down 4.2% over the six-month period between June and December 2022 – a much steeper rate of decline than its 1.9% contraction over the previous six-month period (December 2021–June 2022).
“The US LEI fell sharply again in December – continuing to signal recession for the US economy in the near term. There was widespread weakness among leading indicators in December, indicating deteriorating conditions for labor markets, manufacturing, housing construction, and financial markets in the months ahead.
Meanwhile, the coincident economic index (CEI) has not weakened in the same fashion as the LEI because labor market related indicators (employment and personal income) remain robust. Nonetheless, industrial production – also a component of the CEI – fell for the third straight month.
Overall economic activity is likely to turn negative in the coming quarters before picking up again in the final quarter of 2023.”
The trajectory of the US LEI continues to signal a recession
Sources: conference-board.org