-
The Top 5 Funding Reminders for Roth IRAs

By: Denise Appleby, MJ, CISP, CRC, CRPS, CRSP, APA
The rules of Roth IRAs create multiple tax-saving opportunities for Roth funding.
Many consider Roth IRAs a gold standard for retirement savings because they provide a source of tax-free income during retirement. This tax-free benefit includes tax-deferred earnings, which are tax-free for those eligible for qualified distributions. Taxpayers who choose to fund Roth IRAs instead of traditional IRAs pay taxes upfront in exchange for this benefit. However, the promise of tax-free income is only one of the factors that must be considered, and taxpayers who choose Roth must also consider various strategies and operational requirements. The following reminders are a good start.
1. After-tax 401(k) contributions: an opportunity for tax-free conversions
Once a plan participant is eligible to make withdrawals from their 401(k) or other type of employer plan account (401(k)), eligible amounts may be rolled over to an IRA or another eligible retirement plan. For those who want to continue tax deferral until they are ready to take distributions, a traditional IRA is a common choice for rolling over assets from 401(k)s. However, if the 401(k) account includes after-tax amounts, that after-tax balance is an opportunity for a tax-free conversion.
Unlike a conversion of pre-tax amounts, for which a suitability assessment is often recommended because it is taxable when converted, the conversion of an after-tax amount is tax-free. Therefore, no suitability assessment is needed. Further, any earnings on the after-tax amount would eventually become tax-free in a Roth IRA when you are eligible for a qualified distribution—a contrast with earnings that accrue in a traditional IRA, which would be taxable when distributed.
Essential Tip: If you want to roll over their 401(k) account to an IRA, and that 401(k) includes an after-tax amount, instruct the plan administrator to split the distribution and send the after-tax amount to your Roth IRA. Doing so helps to ensure that the after-tax amount is not sent to your traditional IRA.
2. Micro conversions for tax management
Roth conversions are included in income, with any pre-tax amount being taxable for the year the conversion occurs. However, converting small amounts over time can mitigate the tax impact. For example, an individual who wants to convert $500,000 could make $50,000 yearly conversions over ten years instead of converting the entire $500,000 all at once. This strategy is commonly referred to as micro-conversions.
This strategy can also be used to stay within a tax bracket in cases where a conversion could cause some of the individual’s income to be taxed at a higher tax bracket.
Ideally, you would consult with your tax advisor to project the tax impact of the conversion and help them determine how much would be an ideal amount to convert each year.
3. Tax withholding is not conversion
If you want to have taxes withheld from the requested conversion amount, the withholding tax is not included in the conversion. As a result, the amount withheld for taxes will be subject to the (10% additional tax) 10% early distribution penalty unless an exception applies.
Example 1: 45-year-old Sean’s Traditional Number 12345 had a balance of $100,000—all of which is pre-tax amounts. He instructed his IRA custodian to convert Traditional IRA Number 12345 to his Roth IRA Number 67890 and withhold 20% for federal taxes. Based on his instructions:
- $20,000 was sent to the IRS for federal tax withholding.
- $80,000 was deposited to Roth IRA #64890 as a Roth conversion.
The result:
- $100,000 is included in Sean’s income for the year.
- $100,000 is taxable.
- $80,000 is not subject to the 10% early distribution penalty.
- $20,000 is subject to the 10% early distribution penalty because it is not part of the Roth conversion.
If Sean had funds in a regular savings account (not a tax-deferred account), he could pay the income tax from that account instead of his traditional IRA.
Consideration: An analysis should be done to determine if it makes good tax sense for Sean to perform a Roth conversion if it requires paying the income tax from his IRA.
4. Roth conversion amounts must be rollover eligible
A Roth IRA conversion is a two-part transaction:
- A distribution from the traditional IRA, and
- A rollover to the Roth IRA- which is treated as a conversion.
Consequently, like a rollover, only eligible amounts can be included in the amount credited to the Roth IRA.
An example of an amount that is not eligible to be rolled over is a required minimum distribution (RMD). If you are at least 73 this year, you must take RMDs due from your traditional IRA before any Roth conversion.
Reminder: If the funds are in an employer plan and you are still employed by the plan sponsor, you should check with the plan administrator to determine if you must take an RMD for the year.
5. Let conversion amounts sit and stay for at least 5-years
A Roth IRA conversion is not subject to the 10% early distribution penalty, regardless of the age at which it occurs. However, distribution from a Roth conversion amount is subject to the 10% early distribution penalty if it occurs before it has aged in the Roth IRA for at least five years.
Example 2: Using the facts from Sean’s example above, assume that the conversion was done in 2024. If Sean withdraws any amount from that $80,000 conversion before January 1, 2029, it would be subject to the 10% early distribution penalty unless he qualifies for an exception.
Reminder: The 10% early distribution penalty does not apply if you are at least age 59 ½ when the distribution is made or if the distribution qualifies for an exception to the penalty.
Note: Under the ordering rules, any regular Roth IRA contribution or conversions done in previous years would be drawn before Sean’s 2024 Roth conversion.
Disclaimer
The tips provided in this article are generally operational in nature. The decision of which to choose—Roth IRAs vs. traditional—is more complex and requires a suitability analysis. However, using some of the strategies mentioned in this article can lessen any immediate tax effect. Except for the tax-free conversion of after-tax funds from a 401(k), the assistance of a tax professional should be engaged to help determine suitability.
Original Post by Horsesmouth, LLC.: https://www.savvyira.com/article.aspx?a=99588
-
The Market and Election Cycles
History underscores that shareholders are investing in companies, not a political party
It’s natural for investors to seek a connection between who wins the White House and which was stocks will go. Regardless of who wins, nearly a century of returns shows that stocks have trended upward.
It is also unlikely that making investment decisions based on control of the chambers of Congress will lead to better financial outcomes.
Stocks tend to reward disciplined investors no matter who is President or who controls Congress. This election season, fight the urge to take actions driven by emotions such as fear or greed. Hiring a financial planner can help you stay on track and provide you with well-reasoned advice if and when you become emotional.
Source: https://my.dimensional.com/
-
Understanding the Fed’s Pause on Rate Hikes
Remain vigilant as we might see more rate hikes later this summer
The decision by the Federal Reserve to pause its upward trajectory of the federal funds rate – after 10 straight hikes over the past 14 months – has significant implications for investors. As the central bank of the United States, the Fed’s monetary policy decisions have a profound impact on financial markets and the investment landscape.
Let’s explore what this pause means for investors and explore potential strategies to navigate this new environment.
Understanding the Pause
To grasp the implications of the Fed’s pause, it is crucial to understand the underlying reasons for this shift in policy. The Federal Reserve’s primary mandate is to maintain price stability and support maximum employment. The decision to halt rate hikes suggests that the Fed believes inflationary pressures may be lessening or that the economy requires more time to fully recover. By pausing rate hikes, the central bank aims to provide ongoing support to economic growth.
Bond and Fixed-Income Investments
The Fed’s pause on rate hikes has immediate implications for bond and fixed-income investors. Typically, rising interest rates lead to declining bond prices. However, with the Fed indicating a pause in rate hikes, bond prices may stabilize or even experience modest gains. This is particularly relevant for long-term bondholders who were concerned about potential losses in a rising rate environment.
Nevertheless, investors should remain vigilant. While the pause in rate hikes may provide some relief, it is essential to monitor inflationary trends and the Federal Reserve’s future actions. Unexpected shifts in inflation expectations or the resumption of rate hikes could still impact fixed-income investments.
Equity Markets and Investment Strategies
The Fed’s pause on rate hikes can also have a significant impact on equity markets. Historically, low interest rates have been supportive of stock prices, as they reduce borrowing costs for businesses and increase the present value of future earnings. Investors should consider the potential for continued strength in equity markets as long as the pause in rate hikes persists.
However, it is crucial to exercise caution and avoid complacency. Market conditions can change rapidly, and investors should remain attentive to both global economic developments and the possibility of future rate hikes. Adopting a diversified investment strategy that balances exposure across sectors and geographies can help mitigate risks associated with potential market volatility.
Related Report: Charles Schwab’s Mid-Year Outlook
Sector Rotation and Asset Allocation
The pause in rate hikes offers an opportunity for investors to reassess their sector allocations and asset mix.
Certain sectors, such as utilities and real estate, tend to perform well in a low-interest-rate environment.
These sectors often exhibit stable cash flows and attractive dividend yields, making them appealing to income-focused investors.
Conversely, sectors like financials and banking may face challenges due to narrower interest rate spreads. Investors may consider rotating their investments into sectors that could benefit from the pause in rate hikes, while also maintaining a long-term perspective and keeping diversification in mind.
International Considerations
The Fed’s decision to pause rate hikes also has implications beyond the United States. Lower interest rates in the U.S. can lead to a weaker U.S. dollar, potentially benefiting international investments and exporters. Investors should consider the potential impact on currency valuations and diversify their portfolios by allocating a portion of their investments to international markets.
What Investors Should Do
The Federal Reserve’s pause on rate hikes represents a significant development for investors. The decision suggests that the central bank is carefully monitoring economic conditions and adjusting its policies accordingly. Bond and fixed-income investors may find some respite, while equity investors should remain attentive to potential shifts in market dynamics.
To navigate this evolving landscape, investors should adopt a diversified approach, reassess sector allocations, and consider the potential benefits of international investments.
Staying informed, monitoring economic indicators, and seeking professional advice can help investors make well-informed decisions in this environment of paused rate hikes. Even if it only lasts for a month.

-
Markets Mixed as Growth and Tech Names Jump on Hopes That the Fed Might Have Reached an Inflection Point on Hiking Rates

- This week was dominated by banking worries that started with the collapse of Silicon Valley Bank last week and spread to Signature Bank of New York and a few others this week
- But before markets opened on Monday, Wall Street learned through a joint statement from the Federal Reserve, Treasury, and the FDIC that all depositors at SVB and Signature Bank would be able to access deposits on Monday, despite being taken over by regulators
- When Friday’s final Wall Street bell rung, equity returns were mixed, as the small-cap Russell 2000 lost 2.6%, pushing it into the red for the year (YTD: -2.0%) and the mega-cap DJIA lost 0.1%, pushing it further into the red for the year (YTD: -3.9%)
- The tech-heavy NASDAQ, on the other hand, leapt an astonishing 4.4%, as investors hoped that the Fed’s rate hiking might slow down or be over for the year
- The large-cap S&P 500 inched up 1.4% and is positive for the year (YTD: +2.0%)
- Of the 11 S&P 500 sectors, 6 were positive, with the growth sectors, especially Communication Services (+6.9%) and Information Technology (+5.7%), outpacing the defensive sectors like Utilities (+3.9%) and Consumer staples (+1.3%)
- The 2-year Treasury yield sank 77 basis points to 3.82% and the 10-year Treasury note yield fell 29 basis points to 3.40%
- Oil prices dropped 13.5% this week to $66.33/barrel, the lowest level since December 2021
Weekly Market Update – March 17, 2023
Close Week YTD DJIA 31,862 -0.1% -3.9% S&P 500 3,917 +1.4% +2.0% NASDAQ 11,631 +4.4% +11.0% Russell 2000 1,726 -2.6% -2.0% MSCI EAFE 1,986 -3.5% +2.2% Bond Index* 2,090.71 +1.75% +2.04% 10-Year Treasury 3.41% -0.29% -0.5% *Source: Bonds represented by the Bloomberg Barclays US Aggregate Bond TR USD.
This chart is for illustrative purposes only and does not represent the performance of any specific security. Past performance cannot guarantee future resultsMarkets Mixed as Bank-Failure-Worries Ease
It was another volatile week for equity markets around the world, as pressures mounted on the banking sector as concerns grew after the failures of Silicon Valley Bank and Signature Bank and worries at First Republic Bank and Credit Suisse.
And while pundits were quick to call attention to the big bank failures of 2008/2009, this week was different as governments (including the Fed, the Federal Deposit Insurance Corporation, and the Treasury Department) and other well-capitalized banks stepped in quickly to put worries at ease.
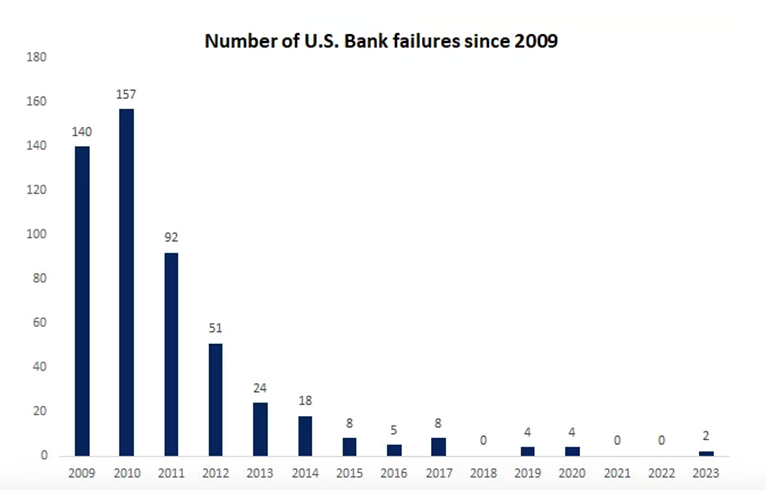
Source: FDIC Then as bond yields dropped swiftly, equities rebounded, giving investors a good case of whiplash. When the week ended, the major U.S. equity indices finished mixed, as the current banking worries might ultimately end up as an inflection point where the Fed slows down or even pauses future rate hikes this year.
Not surprisingly, the 11 S&P 500 sectors varied markedly, with 5 of the 11 ending the week in the red. Specifically, Communication Services (+6.9%) and Information Technology (+5.7%) made big weekly jumps and Financials (-4.9%) and Energy (-6.9%) struggled with big losses. The range in sector returns was further underscored as Large Growth outperformed Large Value by almost 6%.
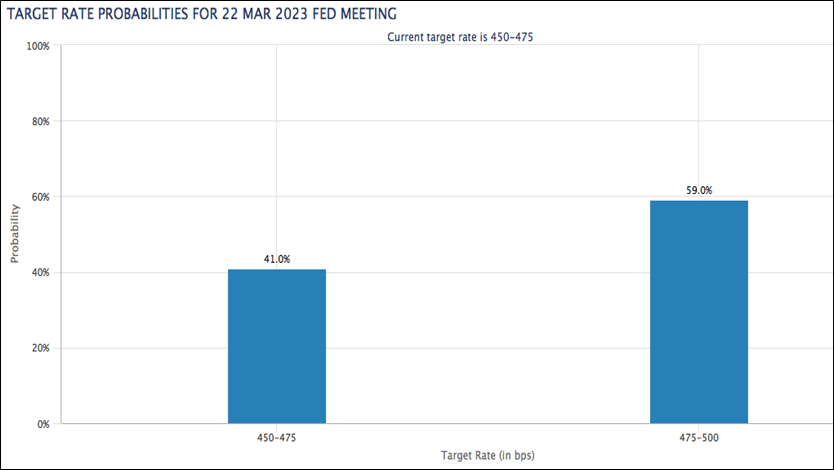
While the bank failures were unpleasant, glass-half-full investors were hopeful that the Fed might adjust its monetary policy and not raise rates by as much. By the end of the week, the fed fund futures markets were pricing in zero likelihood of a 50-basis-point hike versus a 40% chance just one week ago and an almost 40% chance of no rate hike at the Fed’s upcoming meeting on March 21st.
While it seemed everyone was focused on the latest banking news, there was a lot of economic data this week too, including:
- The Consumer Price Index was was up 0.4% month-over-month in February, and up 6.0% year-over-year, which was the smallest 12-month increase since September 2021
- Core CPI, which excludes food and energy, was up 0.5% month-over-month and up 5.5% year-over-year, which was the smallest 12-month increase since December 2021
- The February NFIB Small Business Optimism Index came in at 90.9
- Weekly MBA Mortgage Applications Index were up 6.5%
- February Retail Sales were down 0.4%
- February Retail Sales ex-autos were down 0.1%
- February PPI was down 0.1%
- February Core PPI was flat at 0.0%
- January Business Inventories were down 0.1%
- Weekly Initial Claims came in at 192,000
- February Import Prices were down 0.1%
- February Export Prices were up 0.2%
- Leading Indicators fell 0.3% in February
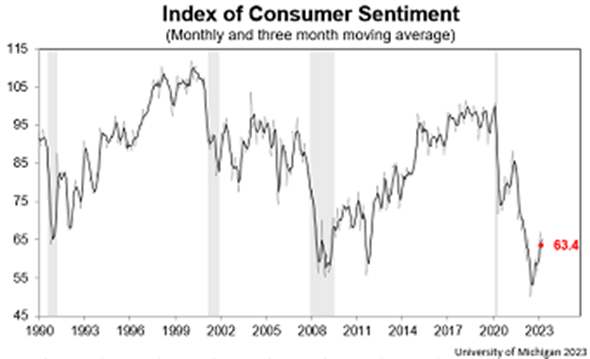
- The preliminary University of Michigan Consumer Sentiment Index for March dropped to 63.4
Consumer Price Index Records Smaller Increase, But Food Index is Up 9.5% Over the Last Year
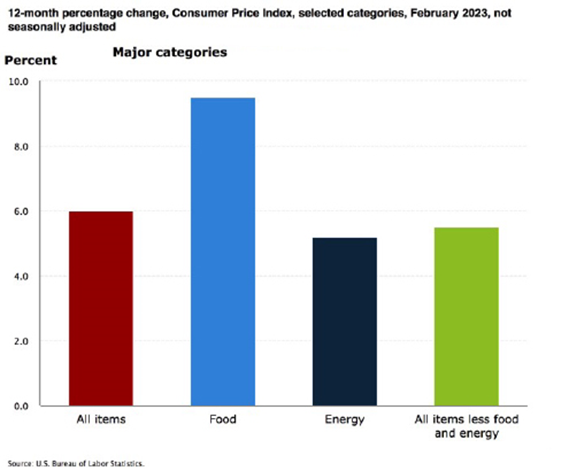
On Tuesday, the U.S. Bureau of Labor Statistics reported that the Consumer Price Index for All Urban Consumers rose 0.4% in February, after increasing 0.5% in January. Over the last 12 months, the all items index increased 6.0% before seasonal adjustment.
Specifically:
- The index for shelter was the largest contributor to the monthly all items increase, accounting for over 70% of the increase, with the indexes for food, recreation, and household furnishings and operations also contributing.
- The food index increased 0.4% over the month with the food at home index rising 0.3%.
- The energy index decreased 0.6% over the month as the natural gas and fuel oil indexes both declined.
- Categories which increased in February include shelter, recreation, household furnishings and operations, and airline
fares. - The index for used cars and trucks and the index for medical care were among those that decreased over the month.
Inflation Over the Past 12-Month
The all items index increased 6.0% for the 12 months ending February; this was the smallest 12-month increase since the period ending September 2021.
- The all items less food and energy index rose 5.5% over the last 12 months, its smallest 12-month increase since December 2021.
- The energy index increased 5.2% for the 12 months ending February.
- The food index increased 9.5% over the last year.
Food Index
- The food index increased 0.4% in February, and the food at home index rose 0.3% over the month. Five of the six major grocery store food group indexes increased over the month. The index for nonalcoholic beverages increased 1.0% in February, after a 0.4% increase the previous month. The indexes for other food at home and for cereals and bakery products each rose 0.3% over the month. The index for fruits and vegetables increased 0.2% in February, and the index for dairy and related products rose 0.1%.
- In contrast, the meats, poultry, fish, and eggs index fell 0.1 percent over the month, the first decrease in that index since December 2021. The index for eggs fell 6.7% in February following sharp increases in recent months.
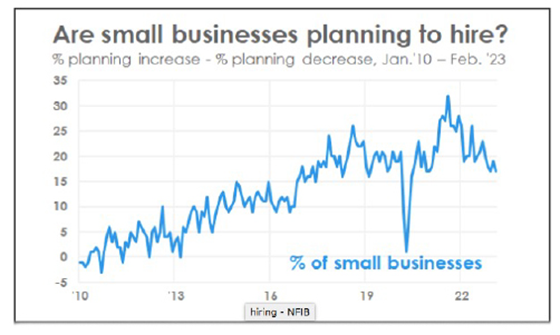
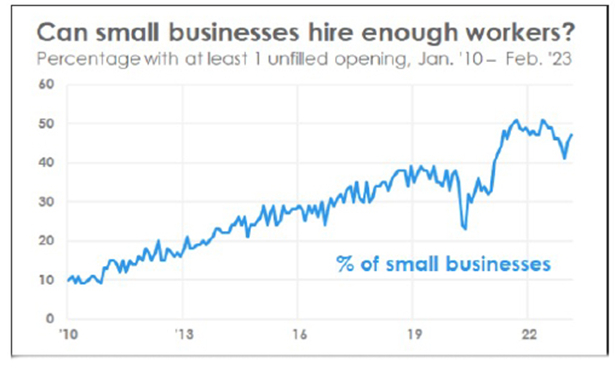
Nearly Half of Small Businesses Have Job Openings They Can’t Fill
Early in the week, the National Federation of Independent Businesses reported that 47% of small business owners reported job openings they could not fill in the current period.
Specifically, “[t]he percent of small business owners reporting labor quality as their top small business operating problem remains elevated at 21%, down three points from January. Labor cost reported as the single most important problem to business owners increased two points to 12%, down one point below the highest reading of 13% reached in December 2021.
A seasonally adjusted net 17% of owners are planning to create new jobs in the next three months, down two points from January and 15 points below its record high reading of 32 reached in August 2021, showing that the trend in planned hiring is on the decline.
Sixty percent of owners reported hiring or trying to hire in January, up three points from January. Of those hiring or trying to hire, 90% of owners reported few or no qualified applicants for the positions they were trying to fill. Thirty percent of owners reported few qualified applicants for their open positions.
Further:
- 46% of owners reported raising compensation, unchanged from last month.
- 23% plan to raise compensation in the next three months, up one point from January.
- 38% of owners have job openings for skilled workers.
- 19% have openings for unskilled labor.
Sources: bls.gov; nfib.com; msci.com; fidelity.com; nasdaq.com; wsj.com; morningstar.com

- This week was dominated by banking worries that started with the collapse of Silicon Valley Bank last week and spread to Signature Bank of New York and a few others this week
-
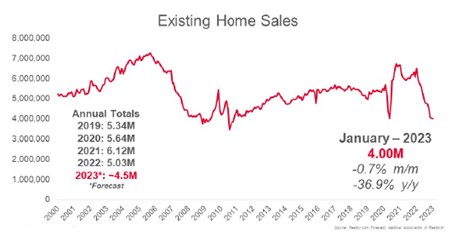
Existing Home Sales Drop for 12th Straight Month, Lowest Since 2010

On Tuesday, the National Association of Realtors reported that existing-home sales fell for the 12th straight month in January. In addition, month-over-month sales were mixed among the four major U.S. regions, as the South and West registered increases, while the East and Midwest experienced declines. All regions recorded year-over-year declines.
Housing Highlights
- Existing-home sales waned for the twelfth consecutive month to a seasonally adjusted annual rate of 4.00 million. Sales slipped 0.7% from December 2022 and 36.9% from the previous year.
- The median existing-home sales price increased 1.3% from one year ago to $359,000.
- The inventory of unsold existing homes grew from the prior month to 980,000 at the end of January, or the equivalent of 2.9 months’ supply at the current monthly sales pace.
Bottoming Out?
“Home sales are bottoming out. Prices vary depending on a market’s affordability, with lower-priced regions witnessing modest growth and more expensive regions experiencing declines. Inventory remains low, but buyers are beginning to have better negotiating power.
Homes sitting on the market for more than 60 days can be purchased for around 10% less than the original list price.”
- The median existing-home pricefor all housing types in January was $359,000, an increase of 1.3% from January 2022 ($354,300), as prices climbed in three out of four U.S. regions while falling in the West.
- This marks 131 consecutive months of year-over-year increases, the longest-running streak on record.
- Properties typically remained on the market for 33 days in January, up from 26 in December and 19 in January 2022. 54% of homes sold in January were on the market for less than a month.
Location, Location, Location- Existing-home sales in the Northeast retracted 3.8% from December, down 35.9% from January 2022. The median price in the Northeast was $383,000, up 0.3% from the previous year.
- In the Midwest, existing-home sales slid 5.0% from the previous month, declining 33.3% from one year ago. The median price in the Midwest was $252,300, up 2.7% from January 2022.
- Existing-home sales in the South rose 1.1% in January from December, a 36.6% decrease from the prior year. The median price in the South was $332,500, an increase of 3.4% from one year ago.
- In the West, existing-home sales elevated 2.9% in January, down 42.4% from the previous year. The median price in the West was $525,200, down 4.6% from January 2022.
Sources: nar.realtor
Copyright © 2023 MainStreet Journal. All rights reserved
Distributed by Financial Media Exchange.