-
Building Permits, Housing Starts, and Housing Completions Up From April

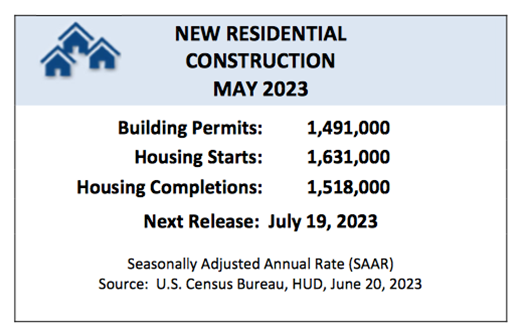
On Tuesday, the U.S. Census Bureau and the U.S. Department of Housing and Urban Development jointly announced the following new residential construction statistics for May 2023:

Building Permits
- Privately‐owned housing units authorized by building permits in May were at a seasonally adjusted annual rate of 1,491,000.
- This is 5.2% above the revised April rate of 1,417,000.
- This is 12.7% below the May 2022 rate of 1,708,000.
- Single‐family authorizations in May were at a rate of 897,000.
- This is 4.8% above the revised April figure of 856,000.
- Authorizations of units in buildings with five units or more were at a rate of 542,000 in May.
Housing Starts
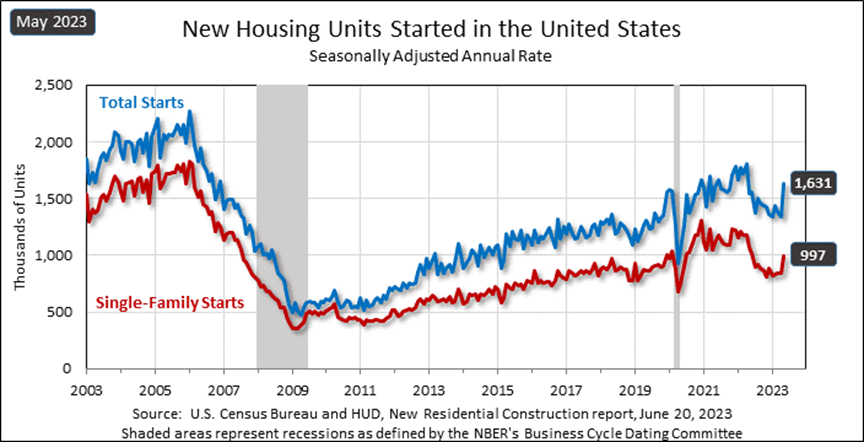
- Privately‐owned housing starts in May were at a seasonally adjusted annual rate of 1,631,000.
- This is 21.7% above the revised April estimate of 1,340,000.
- This is 5.7% above the May 2022 rate of 1,543,000.
- Single‐family housing starts in May were at a rate of 997,000
- This is 18.5% above the revised April figure of 841,000.
- The May rate for units in buildings with five units or more was 624,000.
Housing Completions
- Privately‐owned housing completions in May were at a seasonally adjusted annual rate of 1,518,000.
- This is 9.5% above the revised April estimate of 1,386,000.
- This is 5.0% above the May 2022 rate of 1,446,000.
- Single‐family housing completions in May were at a rate of 1,009,000; this is 3.9% above the revised April rate of 971,000.
- The May rate for units in buildings with five units or more was 493,000.

Sources: nfib.com

-
Existing Home Sales Jump in February as Median Home Prices Slide for the First Time in Almost 11 Years

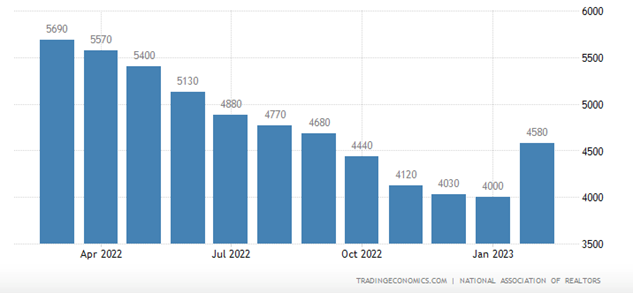
On Tuesday, the National Association of Realtors reported that “existing-home sales reversed a 12-month slide in February, registering the largest monthly percentage increase since July 2020. Month-over-month sales rose in all four major U.S. regions. All regions posted year-over-year declines.
- Total existing-home sales completed transactions that include single-family homes, townhomes, condominiums and co-ops – vaulted 14.5% from January to a seasonally adjusted annual rate of 4.58 million in February.
- Year-over-year, sales fell 22.6% (down from 5.92 million in February 2022).
- Total housing inventory registered at the end of February was 980,000 units, identical to January and up 15.3% from one year ago (850,000).
- Unsold inventory sits at a 2.6-month supply at the current sales pace, down 10.3% from January but up from 1.7 months in February 2022.”
Existing Home Sales

Median Prices Slide After 131 Months of Gains
- “The median existing-home price for all housing types in January was $363,000, a decline of 0.2% from February 2022 ($363,700), as prices climbed in the Midwest and South yet waned in the Northeast and West.
- This ends a streak of 131 consecutive months of year-over-year increases, the longest on record.
- Properties typically remained on the market for 34 days in February, up from 33 days in January and 18 days in February 2022.
- Fifty-seven percent of homes sold in February were on the market for less than a month.
- First-time buyers were responsible for 27% of sales in February, down from 31% in January and 29% in February 2022.
- All-cash sales accounted for 28% of transactions in February, down from 29% in January but up from 25% in February 2022.
- Distressed sales – foreclosures and short sales – represented 2% of sales in February, nearly identical to last month and one year ago.
Regional Breakdown
- Existing-home sales in the Northeast improved 4.0%, down 25.7% from February 2022. The median price in the Northeast was $366,100, down 4.5% from the previous year.
- In the Midwest, existing-home sales grew 13.5%, declining 18.7% from one year ago. The median price in the Midwest was $261,200, up 5.0% from February 2022.
- Existing-home sales in the South rebounded 15.9% in February, a 21.3% decrease from the prior year. The median price in the South was $342,000, an increase of 2.7% from one year ago.
- In the West, existing-home sales rocketed 19.4% in February, down 28.3% from the previous year. The median price in the West was $541,100, down 5.6% from February 2022.”
Sources: nar.realtor

- Total existing-home sales completed transactions that include single-family homes, townhomes, condominiums and co-ops – vaulted 14.5% from January to a seasonally adjusted annual rate of 4.58 million in February.
-
Existing Home Sales Drop for 12th Straight Month, Lowest Since 2010

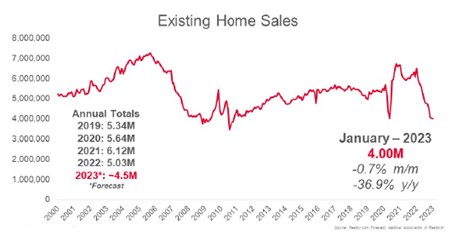
On Tuesday, the National Association of Realtors reported that existing-home sales fell for the 12th straight month in January. In addition, month-over-month sales were mixed among the four major U.S. regions, as the South and West registered increases, while the East and Midwest experienced declines. All regions recorded year-over-year declines.
Housing Highlights
- Existing-home sales waned for the twelfth consecutive month to a seasonally adjusted annual rate of 4.00 million. Sales slipped 0.7% from December 2022 and 36.9% from the previous year.
- The median existing-home sales price increased 1.3% from one year ago to $359,000.
- The inventory of unsold existing homes grew from the prior month to 980,000 at the end of January, or the equivalent of 2.9 months’ supply at the current monthly sales pace.

Bottoming Out?
“Home sales are bottoming out. Prices vary depending on a market’s affordability, with lower-priced regions witnessing modest growth and more expensive regions experiencing declines. Inventory remains low, but buyers are beginning to have better negotiating power.
Homes sitting on the market for more than 60 days can be purchased for around 10% less than the original list price.”
- The median existing-home pricefor all housing types in January was $359,000, an increase of 1.3% from January 2022 ($354,300), as prices climbed in three out of four U.S. regions while falling in the West.
- This marks 131 consecutive months of year-over-year increases, the longest-running streak on record.
- Properties typically remained on the market for 33 days in January, up from 26 in December and 19 in January 2022. 54% of homes sold in January were on the market for less than a month.
Location, Location, Location- Existing-home sales in the Northeast retracted 3.8% from December, down 35.9% from January 2022. The median price in the Northeast was $383,000, up 0.3% from the previous year.
- In the Midwest, existing-home sales slid 5.0% from the previous month, declining 33.3% from one year ago. The median price in the Midwest was $252,300, up 2.7% from January 2022.
- Existing-home sales in the South rose 1.1% in January from December, a 36.6% decrease from the prior year. The median price in the South was $332,500, an increase of 3.4% from one year ago.
- In the West, existing-home sales elevated 2.9% in January, down 42.4% from the previous year. The median price in the West was $525,200, down 4.6% from January 2022.
Sources: nar.realtor
Copyright © 2023 MainStreet Journal. All rights reserved
Distributed by Financial Media Exchange.