-
Market Insights – Nov. 30, 2022
Home-Price-Gains Continue to Decline Across the United States
On Tuesday, S&P Dow Jones Indices released the latest results for the S&P CoreLogic Case-Shiller Indices, the leading measure of U.S. home prices. Data released today for September 2022 show that home price gains declined across the United States.
“The S&P CoreLogic Case-Shiller U.S. National Home Price NSA Index, covering all nine U.S. census divisions, reported a 10.6% annual gain in September, down from 12.9% in the previous month. The 10-City Composite annual increase came in at 9.7%, down from 12.1% in the previous month. The 20-City Composite posted a 10.4% year-over-year gain, down from 13.1% in the previous month.
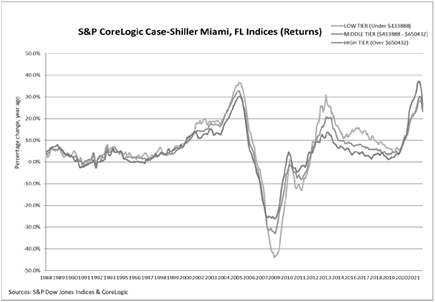
Miami, Tampa, and Charlotte reported the highest year-over-year gains among the 20 cities in September. Miami led the way with a 24.6% year-over-year price increase, followed by Tampa in second with a 23.8% increase, and Charlotte in third with a 17.8% increase. All 20 cities reported lower price increases in the year ending September 2022 versus the year ending August 2022.”
Month-Over-Month
“Before seasonal adjustment, the U.S. National Index posted a -1.0% month-over-month decrease in September, while the 10-City and 20-City Composites posted decreases of -1.4% and -1.5%, respectively.
After seasonal adjustment, the U.S. National Index posted a month-over-month decrease of -0.8%, and the 10-City and 20-City Composites both posted decreases of -1.2%.
In September, all 20 cities reported declines before and after seasonal adjustments.”
Analysis
“As has been the case for the past several months, our September 2022 report reflects short-term declines and medium-term deceleration in housing prices across the U.S. For example, the National Composite Index fell -1.0% in September, and now stands 10.6% above its year-ago level. We see comparable patterns in our 10- and 20-City Composites, which declined -1.4% and -1.5%, respectively, bringing their year-over-year gains down to 9.7% and 10.4%. For all three composites, year-over-year gains, while still well above their historical medians, peaked roughly six months ago and have decelerated since then.
Despite considerable regional differences, all 20 cities in our September report reflect these trends of short-term decline and medium-term deceleration. Prices declined in every city in September, with a median change of -1.2%. Year-over-year price gains in all 20 cities were lower in September than they had been in August.
The three best-performing cities in August repeated their performance in September. On a year-over- year basis, Miami (+24.6%) edged Tampa (+23.8%) for the top spot with Charlotte (+17.8%) beating Atlanta (+17.1%) for third place. The Southeast (+20.8%) and South (+19.9%) were the strongest regions by far, with gains more than double those of the Northeast, Midwest, and West; the two worst- performing cities were San Francisco (+2.3%) and Seattle (+6.2%).”
More Data Later This Week
More economic data will be released later this week, including GDP and MBA Mortgage Applications on Wednesday; Construction Spending and Jobless Claims on Thursday and Motor Vehicle Sales on Friday.
Sources: spglobal.com