-
Markets Mixed as Growth and Tech Names Jump on Hopes That the Fed Might Have Reached an Inflection Point on Hiking Rates

- This week was dominated by banking worries that started with the collapse of Silicon Valley Bank last week and spread to Signature Bank of New York and a few others this week
- But before markets opened on Monday, Wall Street learned through a joint statement from the Federal Reserve, Treasury, and the FDIC that all depositors at SVB and Signature Bank would be able to access deposits on Monday, despite being taken over by regulators
- When Friday’s final Wall Street bell rung, equity returns were mixed, as the small-cap Russell 2000 lost 2.6%, pushing it into the red for the year (YTD: -2.0%) and the mega-cap DJIA lost 0.1%, pushing it further into the red for the year (YTD: -3.9%)
- The tech-heavy NASDAQ, on the other hand, leapt an astonishing 4.4%, as investors hoped that the Fed’s rate hiking might slow down or be over for the year
- The large-cap S&P 500 inched up 1.4% and is positive for the year (YTD: +2.0%)
- Of the 11 S&P 500 sectors, 6 were positive, with the growth sectors, especially Communication Services (+6.9%) and Information Technology (+5.7%), outpacing the defensive sectors like Utilities (+3.9%) and Consumer staples (+1.3%)
- The 2-year Treasury yield sank 77 basis points to 3.82% and the 10-year Treasury note yield fell 29 basis points to 3.40%
- Oil prices dropped 13.5% this week to $66.33/barrel, the lowest level since December 2021
Weekly Market Update – March 17, 2023
Close Week YTD DJIA 31,862 -0.1% -3.9% S&P 500 3,917 +1.4% +2.0% NASDAQ 11,631 +4.4% +11.0% Russell 2000 1,726 -2.6% -2.0% MSCI EAFE 1,986 -3.5% +2.2% Bond Index* 2,090.71 +1.75% +2.04% 10-Year Treasury 3.41% -0.29% -0.5% *Source: Bonds represented by the Bloomberg Barclays US Aggregate Bond TR USD.
This chart is for illustrative purposes only and does not represent the performance of any specific security. Past performance cannot guarantee future resultsMarkets Mixed as Bank-Failure-Worries Ease
It was another volatile week for equity markets around the world, as pressures mounted on the banking sector as concerns grew after the failures of Silicon Valley Bank and Signature Bank and worries at First Republic Bank and Credit Suisse.
And while pundits were quick to call attention to the big bank failures of 2008/2009, this week was different as governments (including the Fed, the Federal Deposit Insurance Corporation, and the Treasury Department) and other well-capitalized banks stepped in quickly to put worries at ease.
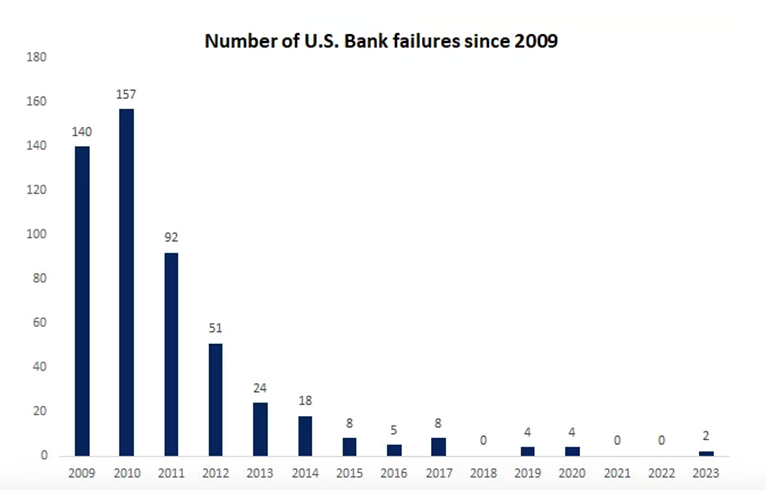
Source: FDIC Then as bond yields dropped swiftly, equities rebounded, giving investors a good case of whiplash. When the week ended, the major U.S. equity indices finished mixed, as the current banking worries might ultimately end up as an inflection point where the Fed slows down or even pauses future rate hikes this year.
Not surprisingly, the 11 S&P 500 sectors varied markedly, with 5 of the 11 ending the week in the red. Specifically, Communication Services (+6.9%) and Information Technology (+5.7%) made big weekly jumps and Financials (-4.9%) and Energy (-6.9%) struggled with big losses. The range in sector returns was further underscored as Large Growth outperformed Large Value by almost 6%.
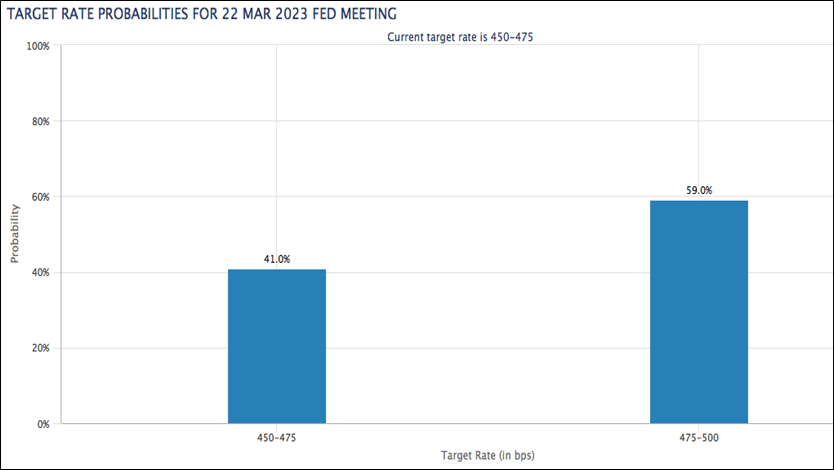
While the bank failures were unpleasant, glass-half-full investors were hopeful that the Fed might adjust its monetary policy and not raise rates by as much. By the end of the week, the fed fund futures markets were pricing in zero likelihood of a 50-basis-point hike versus a 40% chance just one week ago and an almost 40% chance of no rate hike at the Fed’s upcoming meeting on March 21st.
While it seemed everyone was focused on the latest banking news, there was a lot of economic data this week too, including:
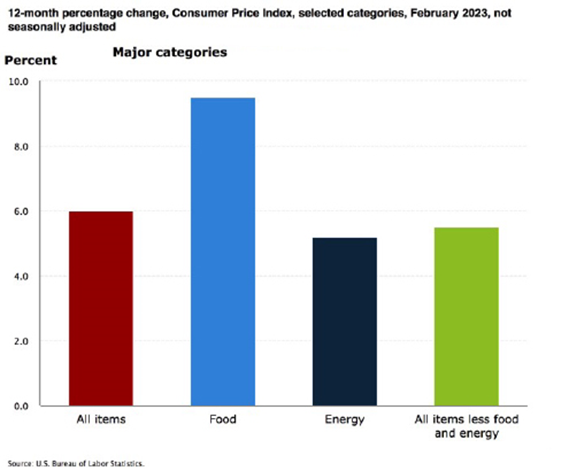
- The Consumer Price Index was was up 0.4% month-over-month in February, and up 6.0% year-over-year, which was the smallest 12-month increase since September 2021
- Core CPI, which excludes food and energy, was up 0.5% month-over-month and up 5.5% year-over-year, which was the smallest 12-month increase since December 2021
- The February NFIB Small Business Optimism Index came in at 90.9
- Weekly MBA Mortgage Applications Index were up 6.5%
- February Retail Sales were down 0.4%
- February Retail Sales ex-autos were down 0.1%
- February PPI was down 0.1%
- February Core PPI was flat at 0.0%
- January Business Inventories were down 0.1%
- Weekly Initial Claims came in at 192,000
- February Import Prices were down 0.1%
- February Export Prices were up 0.2%
- Leading Indicators fell 0.3% in February
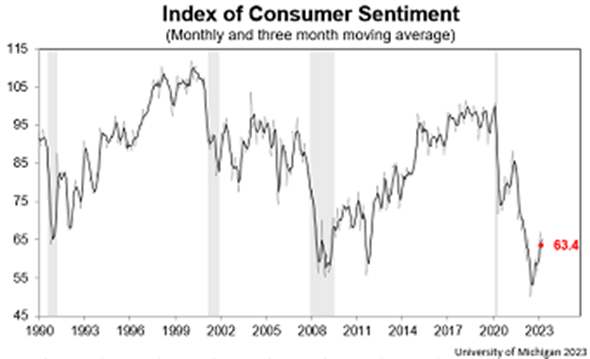
- The preliminary University of Michigan Consumer Sentiment Index for March dropped to 63.4
Consumer Price Index Records Smaller Increase, But Food Index is Up 9.5% Over the Last Year
On Tuesday, the U.S. Bureau of Labor Statistics reported that the Consumer Price Index for All Urban Consumers rose 0.4% in February, after increasing 0.5% in January. Over the last 12 months, the all items index increased 6.0% before seasonal adjustment.
Specifically:
- The index for shelter was the largest contributor to the monthly all items increase, accounting for over 70% of the increase, with the indexes for food, recreation, and household furnishings and operations also contributing.
- The food index increased 0.4% over the month with the food at home index rising 0.3%.
- The energy index decreased 0.6% over the month as the natural gas and fuel oil indexes both declined.
- Categories which increased in February include shelter, recreation, household furnishings and operations, and airline
fares. - The index for used cars and trucks and the index for medical care were among those that decreased over the month.
Inflation Over the Past 12-Month
The all items index increased 6.0% for the 12 months ending February; this was the smallest 12-month increase since the period ending September 2021.
- The all items less food and energy index rose 5.5% over the last 12 months, its smallest 12-month increase since December 2021.
- The energy index increased 5.2% for the 12 months ending February.
- The food index increased 9.5% over the last year.
Food Index
- The food index increased 0.4% in February, and the food at home index rose 0.3% over the month. Five of the six major grocery store food group indexes increased over the month. The index for nonalcoholic beverages increased 1.0% in February, after a 0.4% increase the previous month. The indexes for other food at home and for cereals and bakery products each rose 0.3% over the month. The index for fruits and vegetables increased 0.2% in February, and the index for dairy and related products rose 0.1%.
- In contrast, the meats, poultry, fish, and eggs index fell 0.1 percent over the month, the first decrease in that index since December 2021. The index for eggs fell 6.7% in February following sharp increases in recent months.
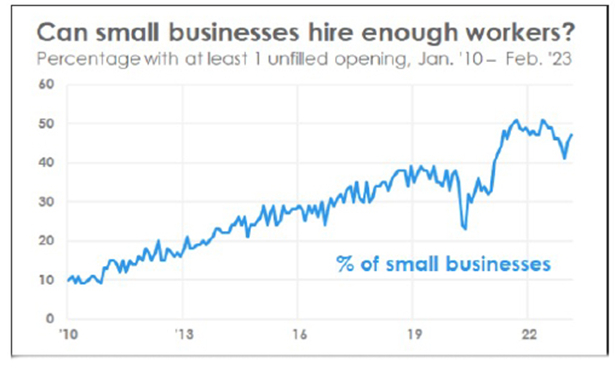
Nearly Half of Small Businesses Have Job Openings They Can’t Fill
Early in the week, the National Federation of Independent Businesses reported that 47% of small business owners reported job openings they could not fill in the current period.
Specifically, “[t]he percent of small business owners reporting labor quality as their top small business operating problem remains elevated at 21%, down three points from January. Labor cost reported as the single most important problem to business owners increased two points to 12%, down one point below the highest reading of 13% reached in December 2021.
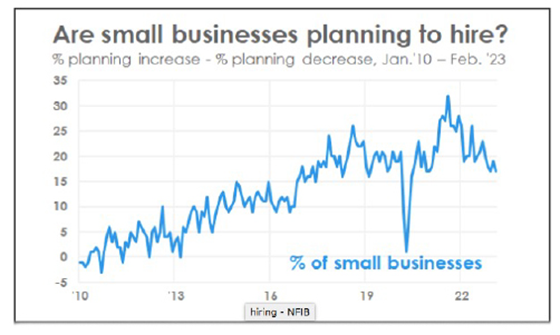
A seasonally adjusted net 17% of owners are planning to create new jobs in the next three months, down two points from January and 15 points below its record high reading of 32 reached in August 2021, showing that the trend in planned hiring is on the decline.
Sixty percent of owners reported hiring or trying to hire in January, up three points from January. Of those hiring or trying to hire, 90% of owners reported few or no qualified applicants for the positions they were trying to fill. Thirty percent of owners reported few qualified applicants for their open positions.
Further:
- 46% of owners reported raising compensation, unchanged from last month.
- 23% plan to raise compensation in the next three months, up one point from January.
- 38% of owners have job openings for skilled workers.
- 19% have openings for unskilled labor.
Sources: bls.gov; nfib.com; msci.com; fidelity.com; nasdaq.com; wsj.com; morningstar.com

- This week was dominated by banking worries that started with the collapse of Silicon Valley Bank last week and spread to Signature Bank of New York and a few others this week
-
Midterm Elections – What Do They Mean For Markets?
Studying the history of stock market returns relative to midterm elections will give you a sense of how impactful they are to your own portfolio’s potential gain or loss.
This article was written by Dimensional Fund Advisors and can be found HERE.
It’s almost Election Day in the US once again. For those who need a brief civics refresher, every two years the full US House of Representatives and one-third of the Senate are up for reelection. While the outcomes of the elections are uncertain, one thing we can count on is that plenty of opinions and prognostications will be floated in the days to come. In financial circles, this will almost assuredly include any potential for perceived impact on markets. But should long-term investors focus on midterm elections?
Markets Work
We would caution investors against making short-term changes to a long-term plan to try to profit or avoid losses from changes in the political winds. For context, it is helpful to think of markets as a powerful information-processing machine. The combined impact of millions of investors placing billions of dollars’ worth of trades each day results in market prices that incorporate the aggregate expectations of those investors. This makes outguessing market prices consistently very difficult.¹ While surprises can and do happen in elections, the surprises don’t always lead to clear-cut outcomes for investors.
The 2016 presidential election serves as a recent example of this. There were a variety of opinions about how the election would impact markets, but many articles at the time posited that stocks would fall if Trump were elected.² The day following President Trump’s win, however, the S&P 500 Index closed 1.1% higher. So even if an investor would have correctly predicted the election outcome (which was not apparent in pre-election polling), there is no guarantee that they would have predicted the correct directional move, especially given the narrative at the time.
But what about congressional elections? For the upcoming midterms, market strategists and news outlets are still likely to offer opinions on who will win and what impact it will have on markets. However, data for the stock market going back to 1926 shows that returns in months when midterm elections took place did not tend to be that different from returns in any other month.
Exhibit 1 shows the frequency of monthly returns (expressed in 1% increments) for the S&P 500 Index from January 1926–June 2022. Each horizontal dash represents one month, and each vertical bar shows the cumulative number of months for which returns were within a given 1% range (e.g., the tallest bar shows all months where returns were
between 1% and 2%). The blue and red horizontal lines represent months during which a midterm election was held, with red meaning Republicans won or maintained majorities in both chambers of Congress, and blue representing the same for Democrats. Striped boxes indicate mixed control, where one party controls the House of Representatives, and the other controls the Senate, while gray boxes represent non-election months. This graphic illustrates that election month returns were well within the typical range of returns, regardless of which party won the election. Results similarly appeared random when looking at all Congressional elections (midterm and presidential) and for annual returns (both the year of the election and the year after).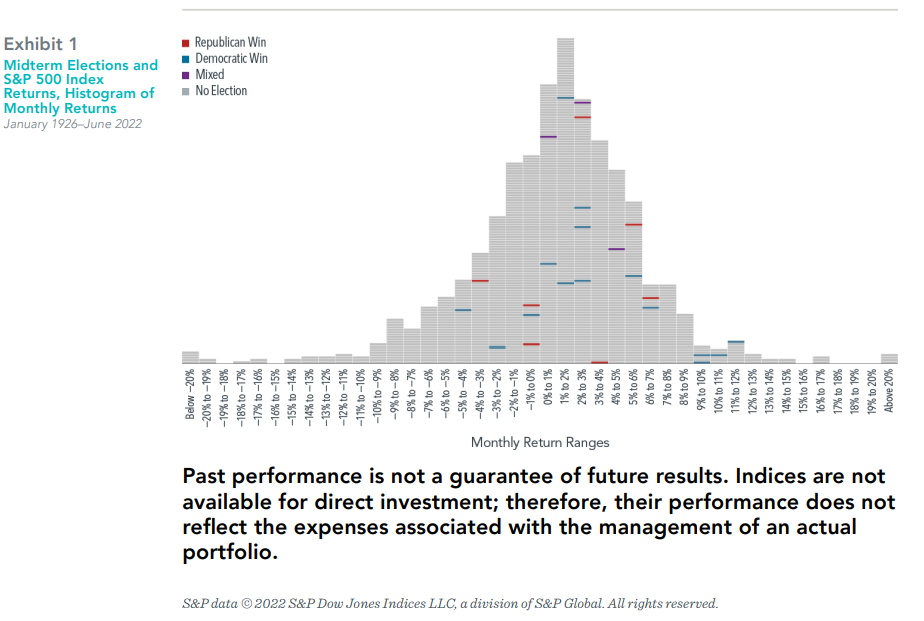
In It For The Long Haul
While it can be easy to get distracted by month-to-month or even one-year returns, what really matters for long-term investors is how their wealth grows over longer periods of time. Exhibit 2 shows the hypothetical growth of wealth for an investor who put $1 in the S&P 500 Index in January 1926. Again, the chart lays out party control of Congress over
time. And again, both parties have periods of significant growth and significant declines during their time of majority rule. However, there does not appear to be a pattern of stronger returns when any specific party is in control of Congress, or when there is mixed control for that matter. Markets have historically continued to provide returns over the long run irrespective of (and perhaps for those who are tired of hearing political ads, even in spite of) which party is in power at any given time.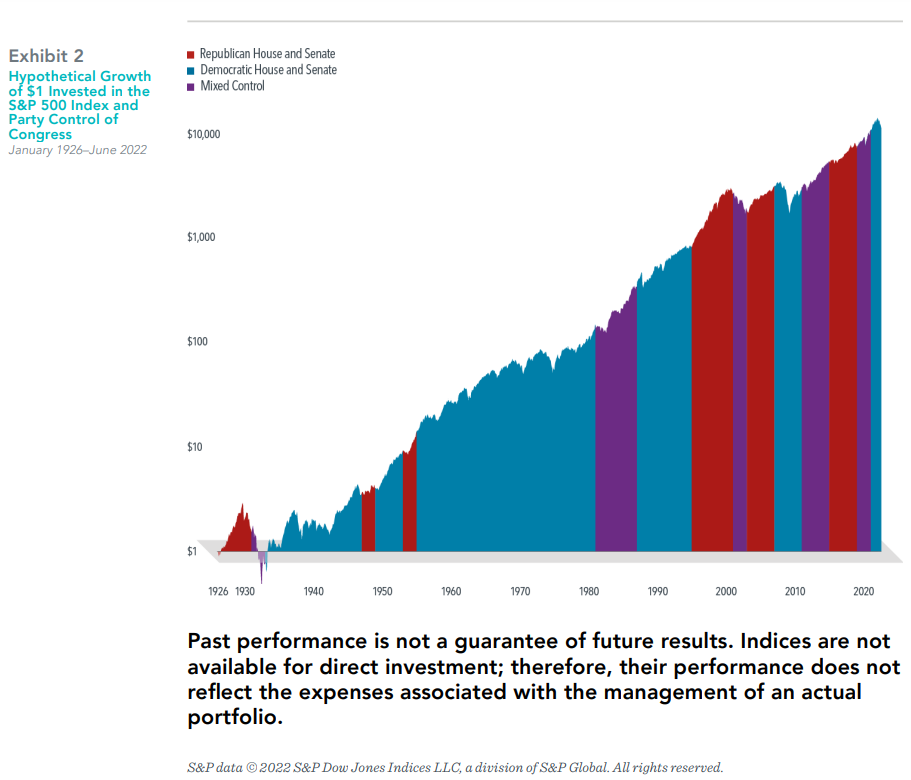
Equity markets can help investors grow their assets, and we believe investing is a long-term endeavor. Trying to make investment decisions based on the outcome of elections is unlikely to result in reliable excess returns for investors. At best, any positive outcome based on such a strategy will likely be the result of random luck. At worst, it can lead to
costly mistakes. Accordingly, there is a strong case for investors to rely on patience and portfolio structure, rather than trying to outguess the market, to pursue investment returns.
- This is known as the efficient market theory, which postulates that market prices reflect the knowledge and expectations of all investors and that any new development is instantaneously priced into a security.
- Examples include: “A Trump win would sink stocks. What about Clinton?” CNN Money, 10/4/16, “What do financial markets think of the 2016 election?” Brookings Institution, 10/21/16, “What Happens to the Markets if Donald Trump Wins?” New York Times, 10/31/16.
In USD. Indices are not available for direct investment. Their performance does not reflect the expenses associated with the management of
an actual portfolio. Past performance is not a guarantee of future results. Diversification does not eliminate the risk of market loss.
There is no guarantee investment strategies will be successful. Investing involves risks, including possible loss of principal. Investors should
talk to their financial advisor prior to making any investment decision. There is always the risk that an investor may lose money. A long-term
investment approach cannot guarantee a profit.
All expressions of opinion are subject to change. This information is intended for educational purposes, and it is not to be construed as an
offer, solicitation, recommendation, or endorsement of any particular security, products, or services.
Dimensional Fund Advisors LP is an investment advisor registered with the Securities and Exchange Commission. - This is known as the efficient market theory, which postulates that market prices reflect the knowledge and expectations of all investors and that any new development is instantaneously priced into a security.
-
Social Security Gets Biggest Boost Since 1981
The Cost of Living Adjustment, or COLA, from the Social Security Administration (SSA) is announced every fall and has major implications for the 66 million people who receive benefit checks. With inflation surging, retirees need help maintaining purchasing power. The agency announced its 2023 COLA will be 8.7%, the highest since 1981.
For those concerned about medical costs eating into this increase, Medicare – the health insurance plan for older Americans – said last month it would drop its premiums next year by about 3% for its Medicare Park B Plan.
For more information and context, please read this article from CBS News.
For instructions on how to sign up for a “my Social Security” account with the SSA, which is the fastest way to find out when and how much you will receive, watch the video below:
-
Cyberattacks in 2022: What You Should Already Know

As the conflict between Russia and Ukraine continues, the United States Government is warning American companies to be vigilant about cybersecurity and to protect themselves against malicious cyberattacks. In a statement on March 22, 2022, FBI Director Christopher Wray said they are “concerned” with the possibility of Russian cyberattacks against critical U.S. infrastructure in the wake of Russia’s war with Ukraine.
“The reason we’re concerned about it is not just based on our longstanding understanding of how the Russians operate, but it’s actually the product of specific investigative work and surveillance work that we’ve been doing all together,” Wray told an audience at the Detroit Economic Club.
The United States Congress recently passed legislation that has since been signed into law that mandates critical infrastructure sectors to report cyber security incidents, involving but not limited to, phishing attacks, malware, and ransomware, to the federal government.
What is Phishing?
Phishing is the fraudulent practice of sending emails or text messages appearing to be from reputable companies or trusted individuals to get recipients to reveal personal information such as passwords and credit card numbers. Phishing attempts are usually urgent-sounding, legitimate-looking emails or texts designed to trick you into disclosing personal information or installing a virus on your device. These scams can be sent as attachments or links that, when opened or clicked, may trigger malicious activity, or take you to fake sites that resemble the real business websites. According to CISCO’s 2021 Cybersecurity Threat Trends report, roughly 90% of all cyber attacks start with a phishing email.
14 phishing red flags to watch for in 2022
What is Malware?
Malware, or “malicious software,” is a catch-all term that describes any malicious program or code that is harmful to systems. Hostile, intrusive, and intentionally nasty, malware seeks to invade, damage, or disable computers, computer systems, networks, tablets, and mobile devices, often by taking partial control over a device’s operations.
How to tell if you’re infected with malware
What is Ransomware?
Ransomware is malware that employs encryption to hold a victim’s information at ransom. A user or organization’s critical data is encrypted so that they cannot access files, databases, or applications. A ransom is then demanded to provide access. According to cybersecurity company Emsisoft, ransomware attacks affected at least 948 government agencies, educational establishments, and healthcare providers in the United States in 2019, at a potential cost exceeding $7.5 billion. Ransomware attacks were up 92% last year, according to the 2022 Cyber Threat Report from SonicWall, a leading cybersecurity firm.
While it is important for small and large businesses to protect themselves and their data from foreign and domestic hackers, it is equally important for individuals to be just as cautious.
How can you protect yourself?
- Be suspicious of unexpected or unsolicited phone calls, emails, and texts asking you to send money or disclose personal information.
- Be cautious when receiving money movement instructions via email.
- Keep your technology up to date, as well as your firewalls and anti-virus software.
- Back up your data and ensure you have offline backups beyond the reach of malicious actors.
- Be strategic with your login credentials and passwords.
- Add two-step verification, which requires you to enter a unique security code each time you login to a website, mobile app, or access your financial accounts.
- Be suspicious of unexpected or unsolicited phone calls, emails, and texts asking you to send money or disclose personal information.