THE SMALLER-CAPS LAG AND 1Q2023 GDP DISAPPOINTS
- It was another mixed week for equity markets, as the large-cap S&P 500, mega-cap DJIA and tech-laden NASDAQ all finished the final week of April in the green while the smaller-cap Russell 2000 and the developed-international markets (MSCI EAFE) finished in the red
- The biggest news on the week seemed to be related to earnings, as some of the big tech names generally reported favorable results, including Alphabet (Google), Microsoft, Meta Platforms (Facebook), and Amazon
- Google and Amazon declined a bit after their earnings report, mostly on future warnings from company executives, while Microsoft and Meta both jumped dramatically
- There was a decent amount of bank worries this week, as First Republic Bank announced an expected disappointing earnings report that showed their deposits were cut in half
- In economic news, the Q1 Gross Domestic Product report showed real GDP increasing at an annualized rate of 1.1%, much lower than expected
- Of the 11 S&P 500 sectors, five were green, led by Communication Services (+3.8%), Information Technology (+2.4%) and Real Estate (+1.5%)
- Of the six losing sectors, the Utilities (-1.0%) and Industrials (-0.6%) saw the biggest declines
- The 2-year Treasury note fell to 4.06% and the 10-year Treasury note yield fell 13 basis points to 3.42%
- The U.S. Dollar Index closed the week at 101.68, which was relatively flat
Weekly Market Update – April 28, 2023
| Close | Week | YTD | |
| DJIA | 34,098 | +0.9% | +2.9% |
| S&P 500 | 4,169 | +0.9% | +8.6% |
| NASDAQ | 12,227 | +1.3% | +16.8% |
| Russell 2000 | 1,769 | -1.2% | +0.3% |
| MSCI EAFE | 2,144 | -0.1% | +10.3% |
| Bond Index* | 2,110.45 | +0.11% | +3.01% |
| 10-Year Treasury | 3.42% | -0.13% | -0.5% |
*Source: Bonds represented by the Bloomberg Barclays US Aggregate Bond TR USD.
This chart is for illustrative purposes only and does not represent the performance of any specific security. Past performance cannot guarantee future results.
Stock Markets Mixed Again This Week to Close out April
Stocks were mixed again this week as the large- and mega-caps outperformed small caps and the tech names outperformed the small, large- and mega-cap indices. It was also one of the busiest earnings week of the season, as about 35% of S&P 500 companies representing about 44% of the S&P 500’s market cap reported this week. And late in the week, it was four of the big tech names that drove markets, as Microsoft, Apple, Amazon, and Meta Platforms (Facebook) accounted for about half of the S&P 500’s gain, driven by Meta’s stunning 14% jump on positive earnings news.
But early in the week, the consensus was markedly negative, as there were reports of regional manufacturing activity coming in well below expectations, indications that factories were cutting back on production and then a very negative outlook report on shipping volumes from United Parcel Service, (which shook its stock down 10% on Tuesday alone).
But then on Wednesday, reports of durable goods data surprised on the upside, as March orders rose 3.2%. But that news was tempered because retail inventories rose 0.4% for the month, more than expected and the most since last August.
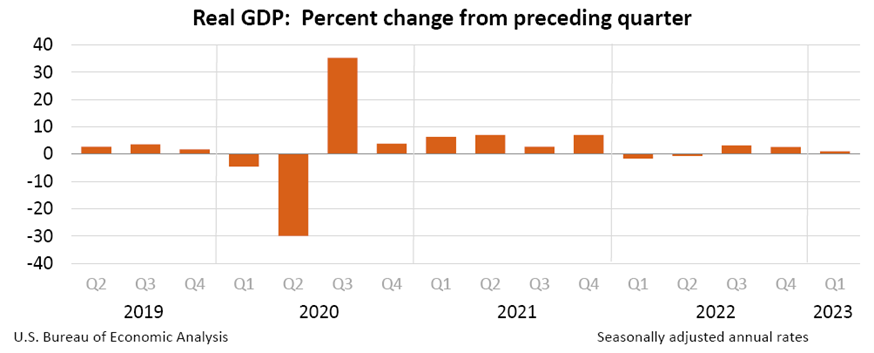
Then on Thursday, the Commerce Department’s estimate of Gross Domestic Product in the first quarter came in at 1.1%, which was below most predictions of about 2%.
The week also brought renewed worries about the banking sector, as First Republic Bank’s earnings release showed that the bank had suffered more than $100 billion in deposit outflows in the first quarter. The news saw the bank’s stock price get cut in half and trickled into the banking and financial services space throughout the week. Then late Friday, news outlets were reporting that the Federal Deposit Insurance Corporation was planning to take the bank into receivership after markets closed on Friday.
GDP Up 1.1% in 1st Quarter
On Friday, the Bureau of Economic Analysis reported that real gross domestic product (GDP) increased at an annual rate of 1.1% in the first quarter of 2023. In the fourth quarter, real GDP increased 2.6%.
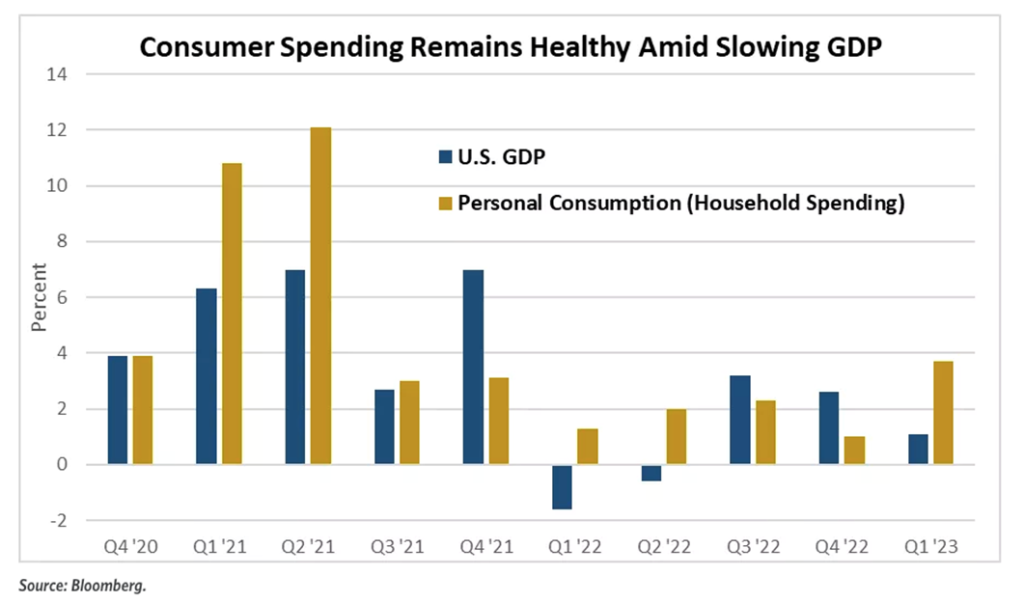
The increase in real GDP reflected increases in consumer spending, exports, federal government spending, state and local government spending, and nonresidential fixed investment that were partly offset by decreases in private inventory investment and residential fixed investment. Imports, which are a subtraction in the calculation of GDP, increased.
“The increase in consumer spending reflected increases in both goods and services. Within goods, the leading contributor was motor vehicles and parts. Within services, the increase was led by health care and food services and accommodations. Within exports, an increase in goods (led by consumer goods, except food and automotive) was partly offset by a decrease in services (led by transport). Within federal government spending, the increase was led by nondefense spending. The increase in state and local government spending primarily reflected an increase in compensation of state and local government employees. Within nonresidential fixed investment, increases in structures and intellectual property products were partly offset by a decrease in equipment.
The decrease in private inventory investment was led by wholesale trade (notably, machinery, equipment, and supplies) and manufacturing (led by other transportation equipment as well as petroleum and coal products). Within residential fixed investment, the leading contributor to the decrease was new single-family construction. Within imports, the increase reflected an increase in goods (mainly durable consumer goods and automotive vehicles, engines, and parts).”
Personal Income Increases
- Current-dollar personal income increased $278.9 billion in the first quarter, compared with an increase of $398.8 billion in the fourth quarter. The increase in the first quarter primarily reflected increases in compensation (led by private wages and salaries) and government social benefits.
- Disposable personal income increased $571.2 billion, or 12.5%, in the first quarter, compared with an increase of $403.0 billion, or 8.9%, in the fourth quarter. The increase in the first quarter reflected an increase in personal income and a decrease in personal current taxes.
- Real disposable personal income increased 8.0% in the first quarter, compared with an increase of 5.0% in the fourth.
- Personal saving was $946.2 billion in the first quarter, compared with $758.8 billion in the fourth quarter.
- The personal saving rate – personal saving as a percentage of disposable personal income – was 4.8% in the first quarter, compared with 4.0% in the fourth.
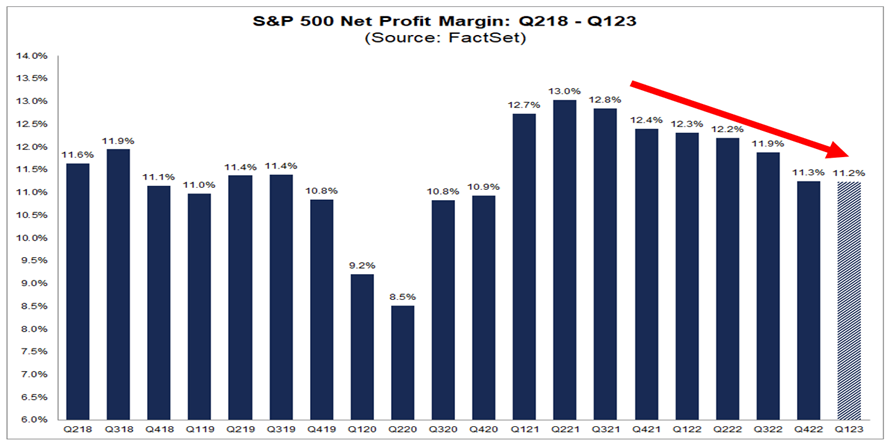
Lower Net Profit Margins For 7th Straight Quarter
Late in the week, research firm FactSet reported that the (blended) net profit margin for the S&P 500 for Q1 2023 was 11.2%, which is below the previous quarter’s net profit margin, below the year-ago net profit margin, and below the 5-year average net profit margin (11.4%).
Further: “If 11.2% is the actual net profit margin for the quarter, it will mark the seventh straight quarter in which the net profit margin for the index has declined quarter-over-quarter. It will also mark the lowest net profit margin reported by the index since Q4 2020 (10.9%).
- At the sector level, three sectors are reporting a year-over-year increase in their net profit margins in Q1 2023 compared to Q1 2022, led by the Energy (11.8% vs. 10.4%) and Consumer Discretionary (6.0% vs. 4.7%) sectors.
- On the other hand, eight sectors are reporting a year-over-year decrease in their net profit margins in Q1 2023 compared to Q1 2022, led by the Materials (9.8% vs. 13.8%) sector.
It is interesting to note that analysts believe net profit margins for the S&P 500 will be higher going forward. As of today, the estimated net profit margins for Q2 2023, Q3 2023, and Q4 2023 are 11.6%, 11.9%, and 11.8%, respectively.”
Durable Goods Orders Up 3.2%
On Thursday, the U.S. Census Bureau announced the March advance report on durable goods manufacturers’ shipments, inventories and orders:
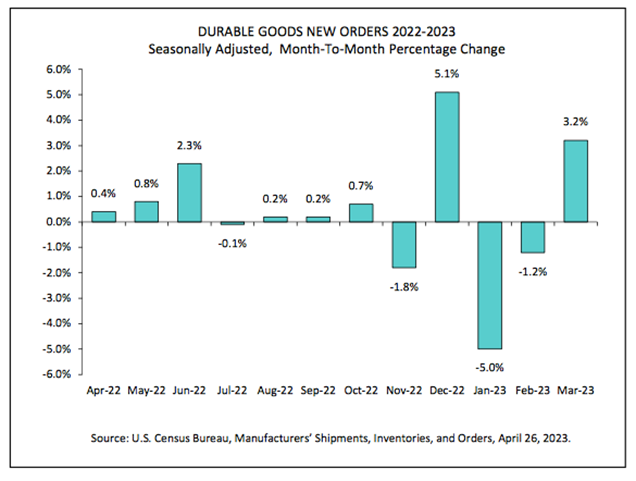
New Orders
New orders for manufactured durable goods in March, up following two consecutive monthly decreases, increased $8.6 billion or 3.2% to $276.4 billion. This followed a 1.2% February decrease.
- Excluding transportation, new orders increased 0.3%.
- Excluding defense, new orders increased 3.%.
- Transportation equipment, also up following two consecutive monthly decreases, led the increase, $8.1 billion or 9.1% to $97.4 billion.
Shipments
Shipments of manufactured durable goods in March, up following two consecutive monthly decreases, increased $2.9 billion or 1.1% to $277.0 billion. This followed a 0.8% February decrease.
- Transportation equipment, also up following two consecutive monthly decreases, drove the increase, $3.3 billion or 3.7% to $93.3 billion.
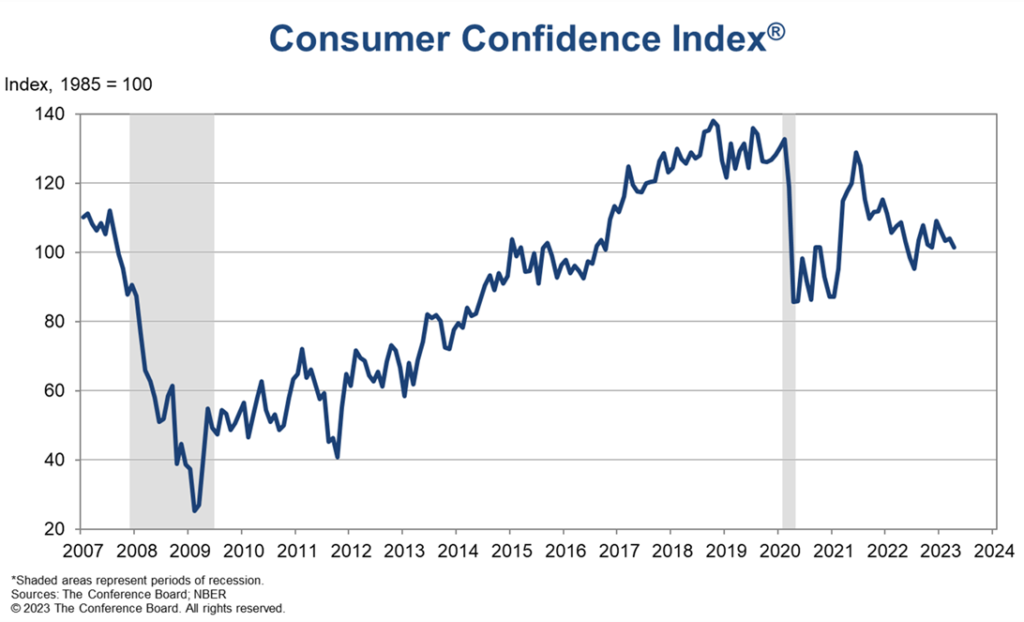
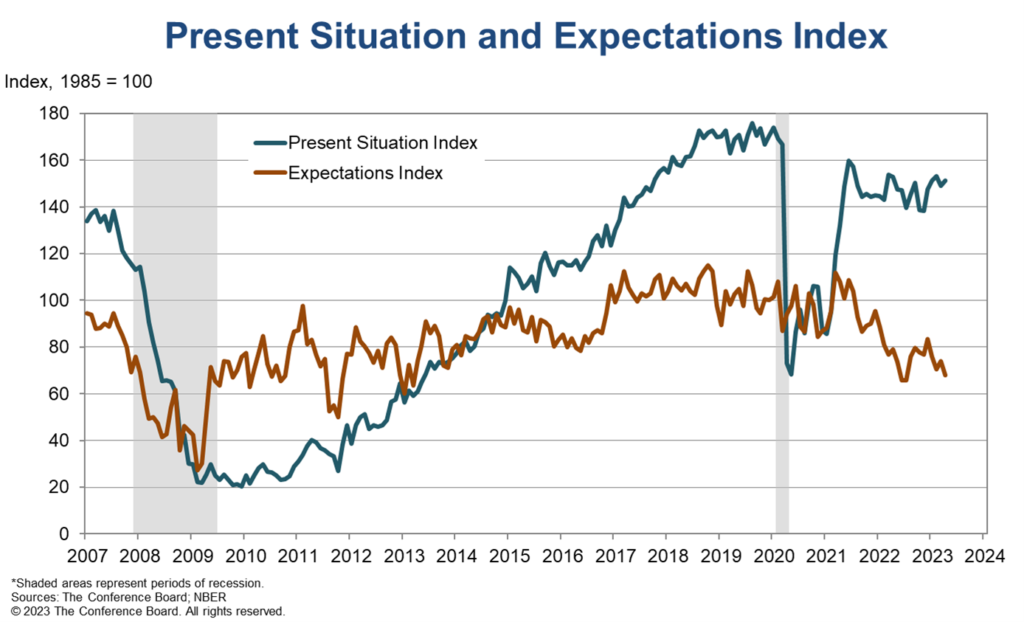
Consumer Confidence Fell in April and Expectations Index Points to a Recession Within the Next Year
The Conference Board Consumer Confidence Index fell in April to 101.3, down from 104.0 in March.
- The Present Situation Index – based on consumers’ assessment of current business and labor market conditions – increased to 151.1 (1985=100) from 148.9 last month.
- The Expectations Index – based on consumers’ short-term outlook for income, business, and labor market conditions – fell to 68.1 (1985=100) from 74.0.
- The Expectations Index has now remained below 80 – the level associated with a recession within the next year – every month since February 2022, with the exception of a brief uptick in December 2022. The survey was fielded from April 3 – about three weeks after the bank failures in the United States – to April 19.
Present Situation
Consumers’ assessment of current business conditions improved somewhat in April.
- 18.8% of consumers said business conditions were “good,” same as last month.
- However, 18.1% said business conditions were “bad,” down from 19.3%.
Consumers’ appraisal of the labor market improved slightly.
- 48.4% of consumers said jobs were “plentiful,” up slightly from 47.9%.
- 11.1% of consumers said jobs were “hard to get,” down slightly from 11.4% last month.
Expectations Six Months Hence
Consumers became more pessimistic about the short-term business conditions outlook in April.
- 13.5% of consumers expect business conditions to improve, down from 16.4%.
- And, 21.5% expect business conditions to worsen, up from 19.2%.
Sources: factset.com; bea.gov; census.gov; msci.com; fidelity.com; nasdaq.com; wsj.com; morningstar.com